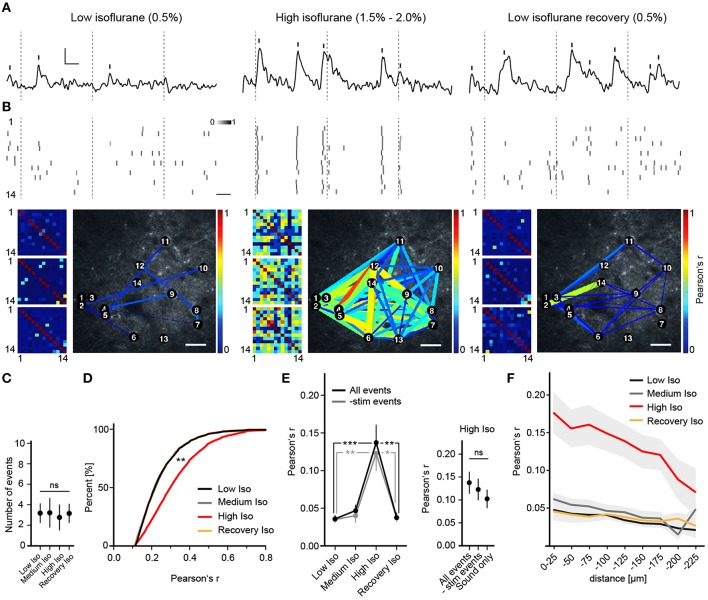
Figure 2.
Deep anesthesia enhances neural synchrony. (A) Random example fluorescence traces of the same cell under different anesthetic conditions. Vertical bars mark detected peaks, inset: 5% ΔR/R (y-axis), 5 s (x-axis). (B) Extracted peak time points of all cells shown as probabilities over adjacent frames (Top panel, scale bar: 5 s), color-coded correlation matrices for Pearson's r of 3 example trials (Bottom panel, small pictures) and example correlation maps (Bottom panel, big pictures, scale bar: 30 μm). Inset: color-code for peak probability (white = 0 to black = 1). Dotted lines indicate time points of whisker stimulation. Correlation is expressed as Pearson's correlation coefficient (r) and color-coded from r = 0 (blue, no correlation) to r = 1 (red, perfect positive correlation). (C) The number of detected peaks per cell (mean over all trials and cells ± SD; ANOVA, p = 0.71). (D) Correlation r's filtered for significance (p < 0.05) shift toward higher values with high isoflurane: cumulative frequency distribution for all pairwise correlation r's (p < 0.01 High Iso vs. Low Iso). (E) High isoflurane concentrations induce a marked increase in overall synchrony that is independent of sensory stimulation. (Left) Mean pairwise correlation of all cell pairs for the indicated isoflurane concentration over all trials per mouse (mean ± SEM, *p < 0.05, **p < 0.01 ***p < 0.001). (Right) Summary of correlation r-values under a high isoflurane concentration (mean ± SEM). The same analysis as above was additionally performed for trials where only auditory stimulation was present (All peaks vs. subtracted p = 0.58, All peaks vs. Sound only; p = 0.43). (F) High isoflurane concentrations preferentially increase synchrony between nearby neurons. Shown is the mean pairwise correlation (Pearson's r) plotted against pairwise distance (bin size: 25 μm) (mean ± SEM).

