Figure 3.
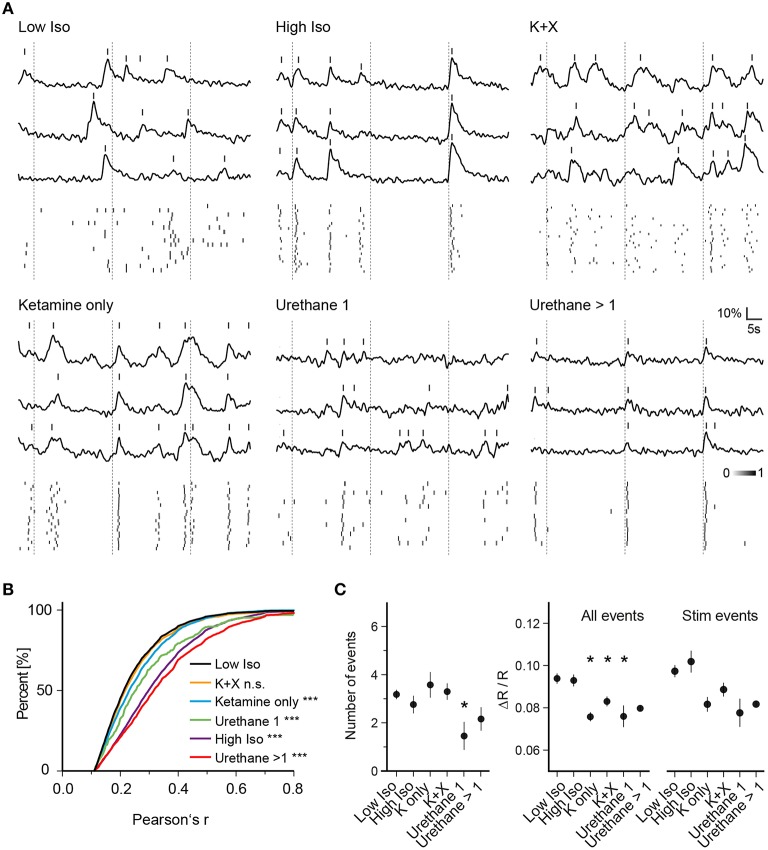
Anesthesia-dependent synchrony is similarly induced by chemically distinct anesthetics. (A) Example traces of three cells for one trial of each anesthetic condition are shown. (Top) Ca2+ signal traces; (Bottom) peak probability matrix. Dotted lines: time of air-puff stimulus (B) Cumulative frequency distributions of Pearson's r over all cell pairs and trials. Values were pre-filtered for significance level of p < 0.05 as in Figure 2D (see Section Materials and Methods for details); the low isoflurane dataset is shown in black and is taken as baseline condition and as a reference for statistical testing. A substantial rise in correlation between cell pairs was observed for all anesthetic conditions except Ketamine + Xylazine (K + X) (***p < 0.001 for all datasets vs. Low Iso except K + X). (C) Mean number of events per trial, mean amplitude of all events per trial and mean amplitude of all stimulus evoked responses per trial over all trials are plotted (mean ± SEM, *p < 0.05).

