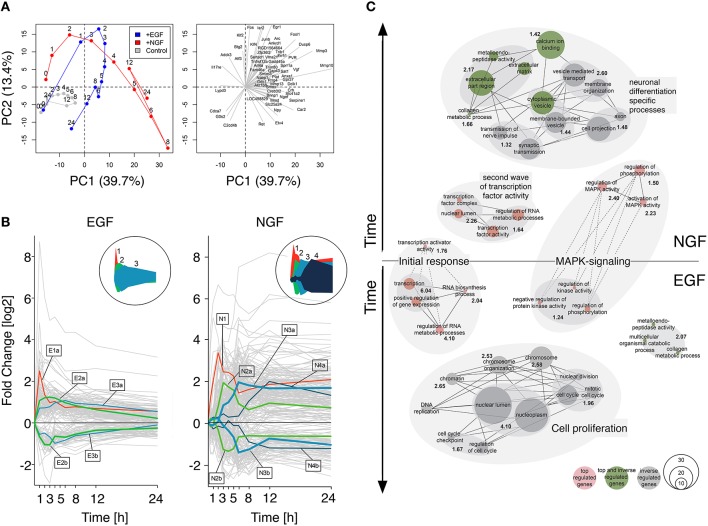
Figure 1.
Gene response dynamics after NGF or EGF stimulation. (A) Principal component analysis (PCA) of the PC12 cell transcriptomes after NGF (red), EGF (blue) and control treatment (gray). The PCA scores (left panel) and loadings (right panel) correspond to the samples and genes, respectively. Samples in the left panel have been connected to guide the eye. Clearly, EGF and NGF samples remain close in the first 3 h and separate at later timepoints, indicating a different cellular phenotype. Right panel: 50 largest loading vectors indicating the impact and time of action of individual genes. Immediate early genes, like Fos or Ier2 point toward early timepoints, while loadings pointing toward the right, like Vgf or Npy, correspond to late timepoints and are most likely involved in differentiation. (B) Expression clusters of top regulated genes. The left and right panels depict the response of individual genes to EGF and NGF stimulation, respectively (gray lines). Cluster centroids are marked by lines with the cluster size encoded by line thickness. The circular inserts depict the cluster centroid envelopes for EGF and NGF, respectively. (C) Network representation of functional enrichment of NGF and EGF response genes. The network is comprised of GO-term clusters having a significant enrichment (−log10(p-value) >1.3) as shown in bold black numbers. Red, gray and green nodes contain in this order top-regulated genes, inversely-regulated genes between EGF and NGF or both. The vertical node location corresponds to the peak regulation of their genes, while node size is proportional to the number of genes in a functional category. Edges indicate a gene overlap of >20% between nodes, being drawn as dashed lines, if they are shared between EGF and NGF.

