Figure 2.
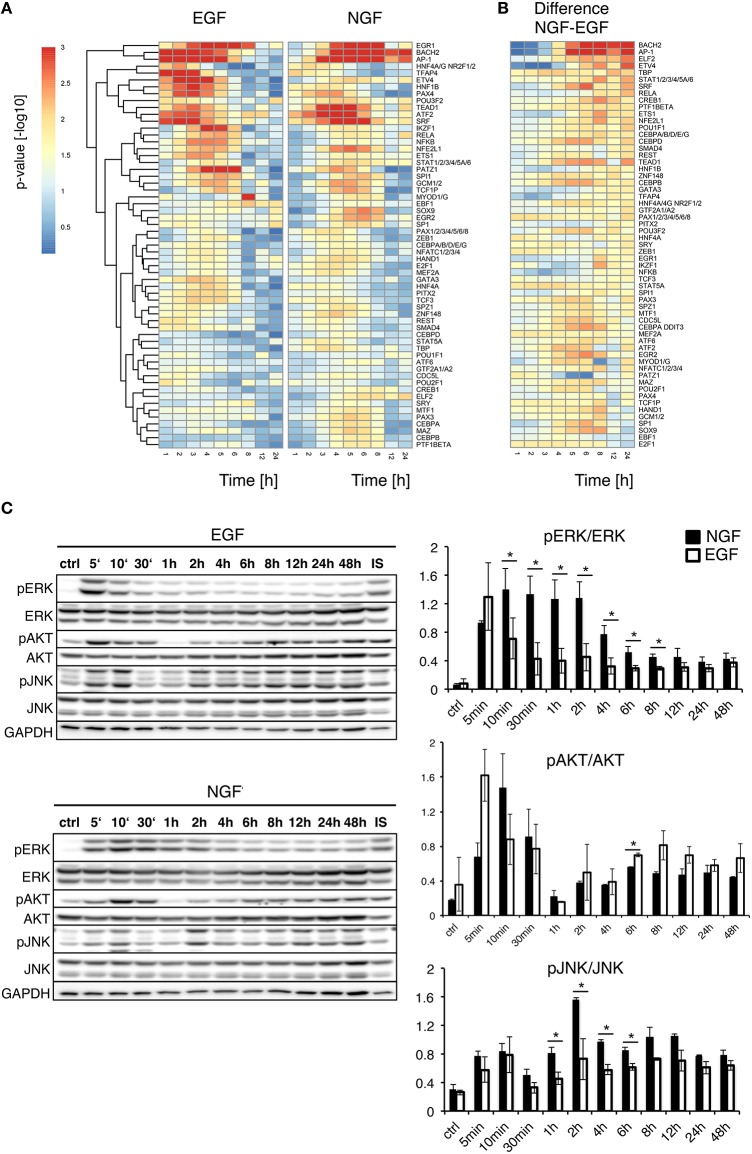
Upstream analysis of gene expression timeseries. (A) Upstream Gene Set Enrichment Analysis for transcription factors. The heatmaps depict the significance of transcription factors putatively controlling the gene response after EGF (left) or NGF stimulation (right). All TFs are significantly regulated (FDR corrected p-value < 0.01) after NGF treatment. TFs have been clustered by their Euclidean distance across all conditions using a complete linkage method. (B) Difference in TF p-value significance (NGF-EGF). Rows were ordered from the most positive to the most negative difference at t = 12 and 24 h. (C) Time-resolved quantification of pERK, pAKT and pJNK after EGF and NGF treatment. Original western blots from PC12 cells treated with 75 ng/ml EGF and 50 ng/ml NGF over time. GAPDH is shown as loading control, IS: Internal Standard. Statistical analysis of the pERK/ERK, pAKT/AKT and pJNK/JNK levels are shown on the right panel. An increased and significant higher pERK/ERK level is shown in NGF stimulated (shown as black bars) cells compared to EGF (shown as white bars). A similar trend is visible for pJNK/JNK. A * denotes a p-value < 0.05, data points obtained in duplicates and triplicates.

