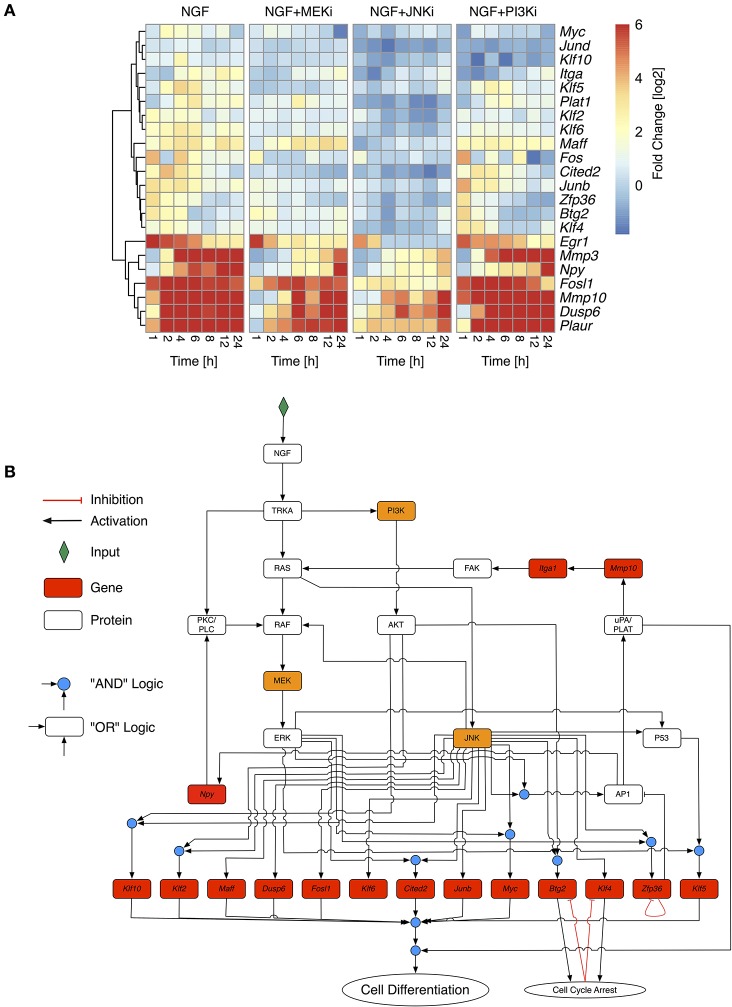
Figure 3.
Selective inhibition of NGF-induced PC12 differentiation. (A) Fold change values of selected response genes in PC12 cells after NGF stimulation under additional inhibition of MEK (NGF+MEKi), JNK (NGF+JNKi), or PI3K (NGF+PI3Ki). Fold change values have been calculated from biological triplicates relative to the unstimulated control per timepoint. To retain the contrast of less variable genes the maximal fold change has been restrained to +6. Genes have been clustered by their Euclidean distance across all conditions using a complete linkage method. (B) Optimized Boolean Network based on the training data in (A). Nodes in red have been measured on the transcript level. Orange nodes indicate inhibited proteins.

