Figure 4.
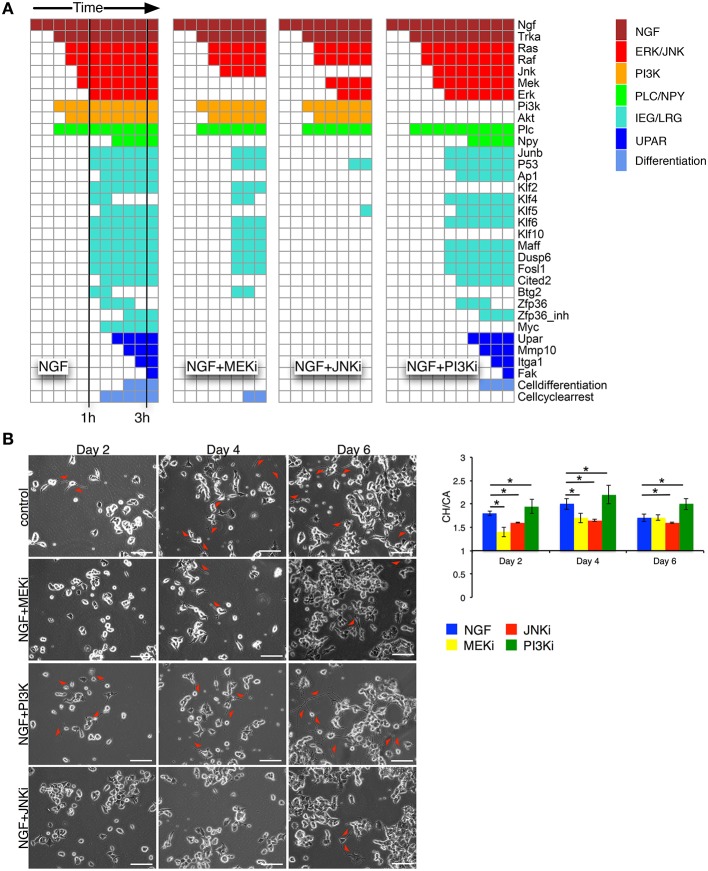
Network simulation of time sequential pathway activation and experimental validation. (A) The heatmaps depict the path to attractor upon NGF stimulation. Columns correspond to synchronous update steps of the Boolean network. Time progresses from left to right until a steady state is reached. Initially all nodes, except NGF, are set to zero. Colored boxes correspond to activated nodes with the color denoting individual pathways/node categories. Cells are predicted to differentiate, if the node “Cell differentiation” is active, as in the case for NGF, or NGF+PI3Ki treatment. (B) Left: phase contrast images for days 2, 4, and 6 are shown for the 4 different conditions: NGF (control), NGF+MEKi, NGF+PI3Ki and NGF+JNKi. Red arrows depict sites of neurite outgrowth in differentiating PC12 cells. Bar: 100 μm. Right: statistical analysis of PC12 cell differentiation from phase contrast imaging for the different conditions are shown as convex hull (CH) to cell area (CA) ratio. Bars show Mean ± SEM, n = 2, (*t-test p-value < 0.05).

