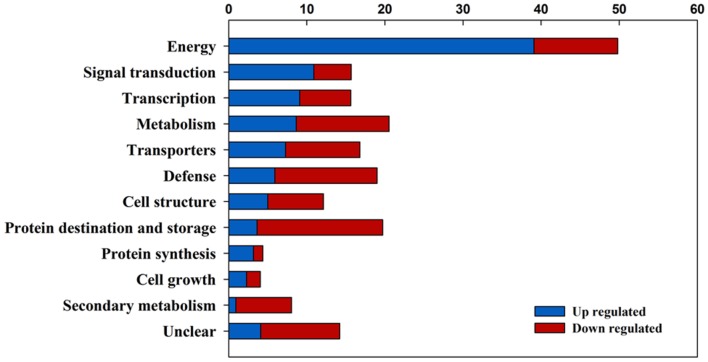
FIGURE 2.
The summarized gene ontology analysis of the differently expressed genes between progeny of primed plants (PH) and non-primed plants (NH) under heat stress during grain filling. The blue bars stand for the up-regulation of expressions of clustered genes in PH relative to NH; the red bars stand for the down-regulation of expressions of clustered genes in PH relative to NH.

