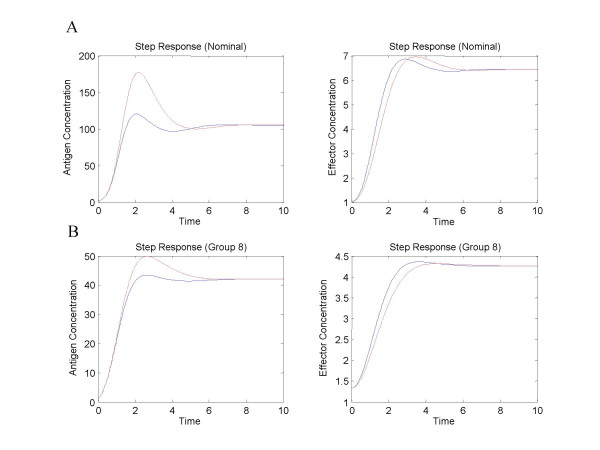
Figure 4.
Step responses to source antigen increase. Step responses to a four-fold increase in source antigen are presented for both the nominal values (panel A) (from Irvine and Savageau) and for a case in which the values were drawn from a narrow distribution about those nominal values (panel B). Systemic antigen responses are shown on the left and effector on the right. Solid lines indicate the response for the reference system (with suppression) and dashed lines are used for the alternative. Step responses for the nominal values indicate a preference for the system with suppression. The step responses for the sampled case indicate a preference for the alternative when considering dynamic peaks for effector concentration.

