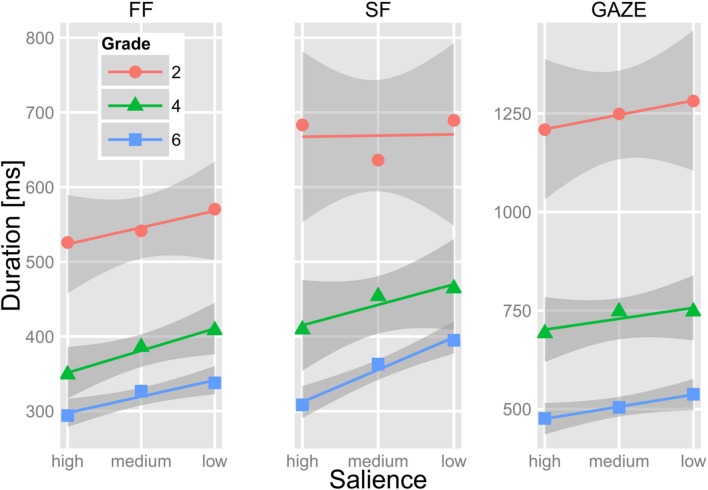
FIGURE 3.
Mean first fixation (FF), single fixation (SF), and gaze duration on the target word of the children from Grades 2, 4, and 6 in relation to the salience of its parafoveal preview. The lines show the linear trends of fixation durations in relation to salience. The gray shadings depict 1 SEM as estimated with the smooth-function (method = “l m”) of the ggplot-package (Wickham and Chang, 2015).

