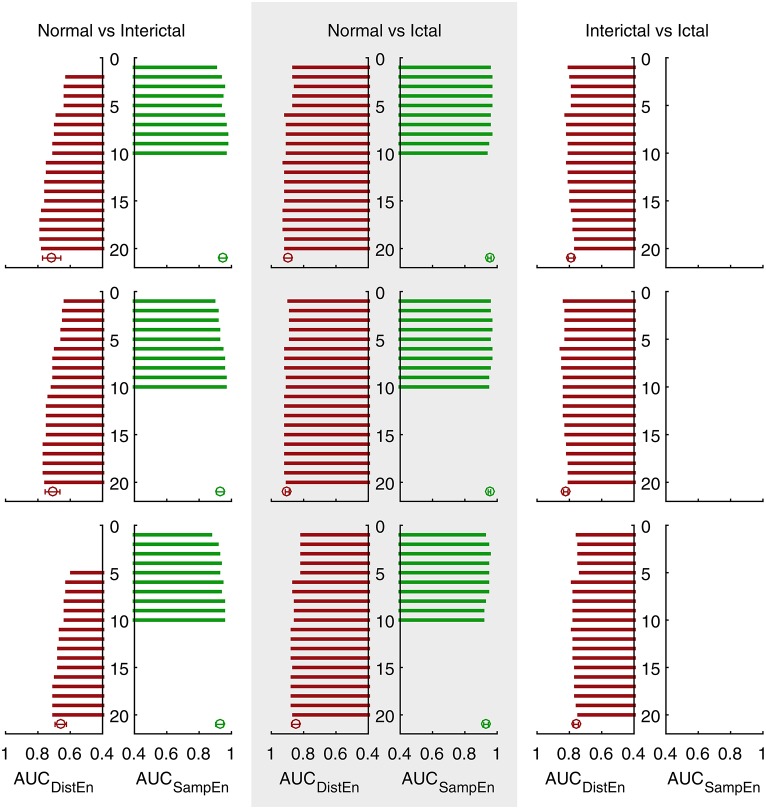
Figure 3.
Area under the ROC curves (AUC) of three different protocols (see Supplementary Figures 1–3 for detailed ROC results). Bars show AUC of ROC curves with feature indices from 1 to 20. Error bars show the average and standard deviation of the corresponding AUC sets (undefined values excluded).

