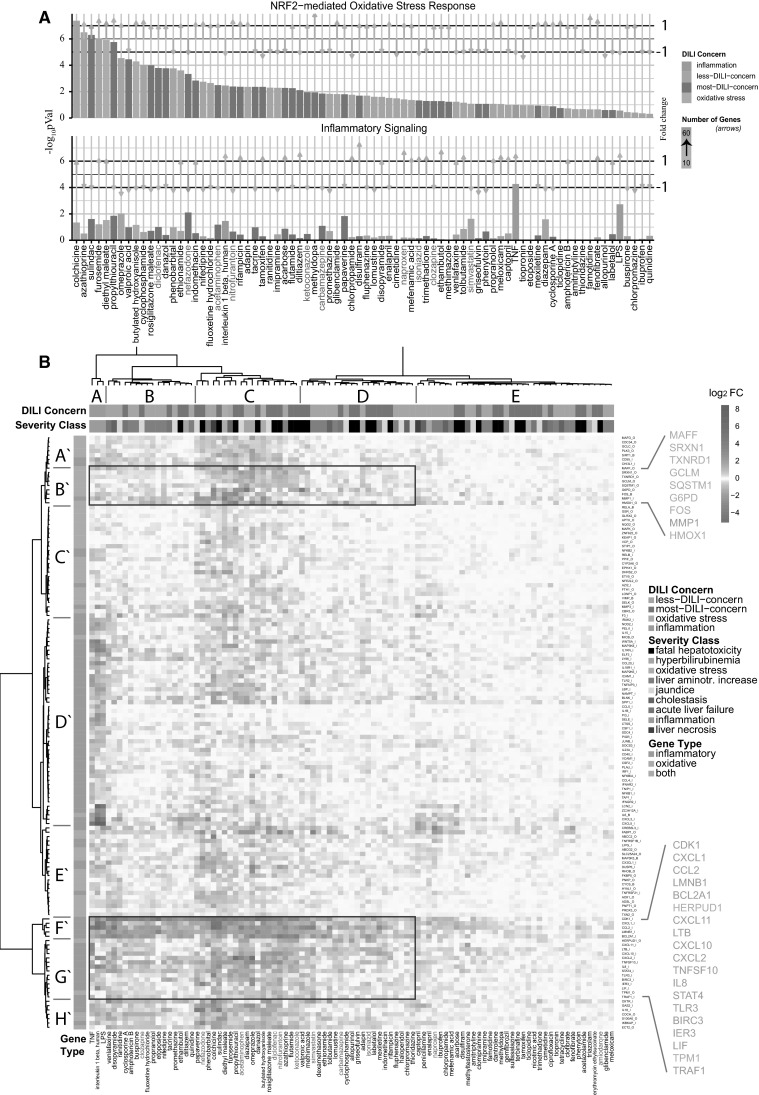
Fig. 1.

Gene expression analysis of 24-h highest concentration primary human hepatocyte subset of the TG-GATEs dataset. a Differentially expressed genes were analyzed with Ingenuity Pathway Analysis as described in detail in the “Materials and methods” section. In the top panel, the −log10 p values for the corresponding pathways are displayed for the Nrf2-mediated oxidative stress response. The top panel displays the mean of the p values for the inflammatory-related pathways. Compounds are ordered according to highest significance of the Nrf2-mediated oxidative stress response. The compound labels in red are the compounds chosen in this study. The color of the bars corresponds to DILI severity type or to the oxidative stress/inflammatory model compounds (model compound type). The length of the arrows corresponds to the mean fold change of the genes which are responsible for the significance of the corresponding pathways. The direction of the arrow corresponds to either mean up- or downregulation of these genes. The color of the arrows corresponds to the number of these genes ranging from 10 to 60 genes. b Unsupervised hierarchical clustering of all DILI compounds and a selected gene set as described in detail in the “Materials and methods” section. Blue corresponds to downregulated genes, and orange, to upregulated genes; the brightness corresponds to the magnitude of the fold changes. The top color-coded bar corresponds to the DILI concern or model compound type. The second top color-coded bar corresponds to the severity class or model compound type. The left color-coded bar corresponds to the gene type—either inflammatory genes, oxidative genes or both. Important clusters on gene level are represented from A′ to H′, and important compound-level clusters with A–E for easy reference from the text. Compounds used in this study are color-coded in red (color figure online)
