Fig. 4.

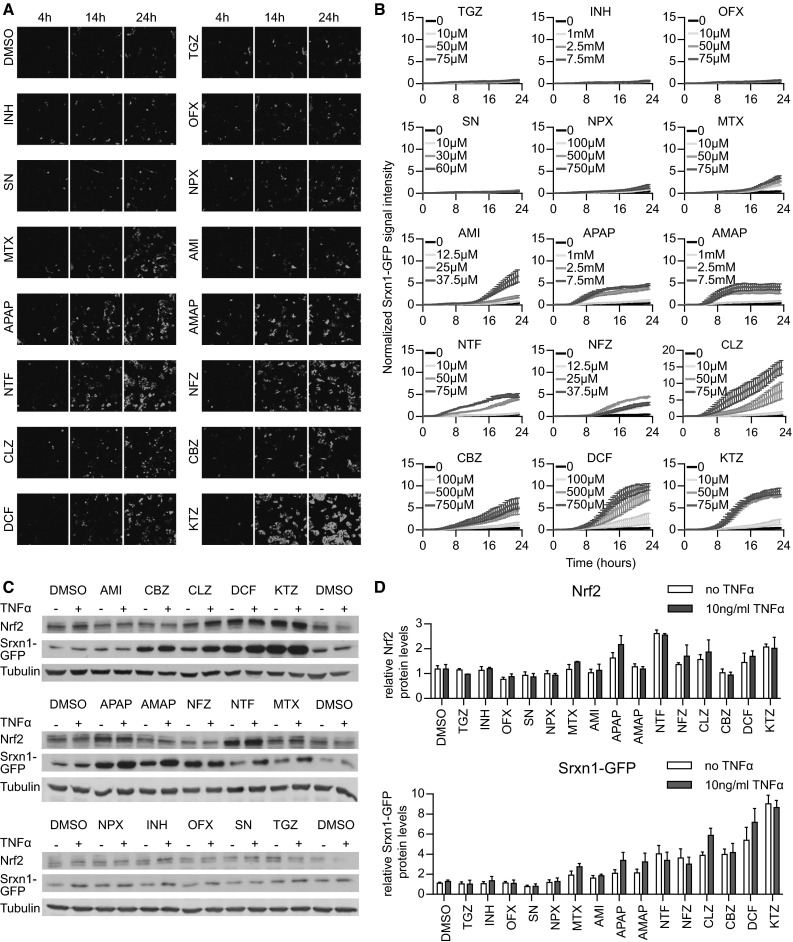
Drug exposure induces dynamically divergent Nrf2 responses. a Stills of confocal live-cell imaging in HepG2 Srxn1-GFP cells upon drug exposure (shown are 4, 14 and 24 h). b Quantification of the Srxn1-GFP signal appearing upon exposure to increasing drug doses (averages shown of four independent replicates). c Western blots for Nrf2 and GFP expression after 24-h drug exposure in HepG2 Srxn1-GFP cells, either with or without co-exposure to 10 ng/mL TNFα. d Quantification of the Nrf2 and Srxn1-GFP protein levels, 24 h after drug ±TNFα exposure (averages of three replicates)
