Figure 1.
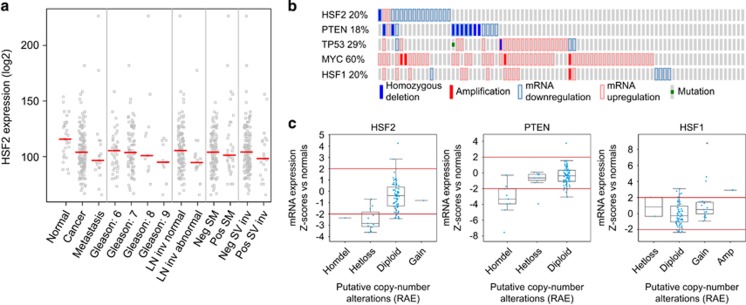
Low HSF2 expression correlates with aggressiveness of PrCa in human clinical samples. (a) Decreased HSF2 expression correlates with advanced PrCa. Analysis of mRNA expression for HSF2 in data sets from human PrCa (MSKCC),24 indicating that HSF2 expression is decreased in PrCa compared with normal tissue, and further decreased in advanced PrCa (Gleason score ⩾8), metastases, lymph node invasion (LN inv abnormal), positive surgical margins (SM) and positive seminal vesicle invasion (SV inv). (b) Oncoprints of HSF2, PTEN, TP53, MYC and HSF1 across 85 PrCa tumors,24 indicating genomic alterations. Individual genes are represented in each row, and individual tumors are represented as columns. Genetic alterations are color coded: dark blue, homozygous deletion; red, amplification; light blue frame, mRNA downregulation; pink frame, mRNA upregulation; green square, mutation. The oncoprints are based on data obtained from the cBioPortal for Cancer Genomics (http://www.cbioportal.org/public-portal/). Z-score threshold±2. (c) Box and whisker plots indicating the expression of HSF2, PTEN or HSF1 mRNA across different subsets of PrCa tumors divided by the putative DNA copy-number status. Homdel, homozygous deletion; hetloss, heterozygous deletion; diploid, no change; gain, moderate amplification; amp, high-level amplification. HSF2 mRNA expression is as expected progressively lower across the different subgroups of PrCa with HSF2 ploidy status ranging from gain to homozygous deletion. Note that the scales for copy-number status (x axis) and mRNA expression (y axis) differ between the three graphs. The mRNA z-scores are compared with the expression in normal prostate samples. RAE, RAE algorithm.

