Figure 5.
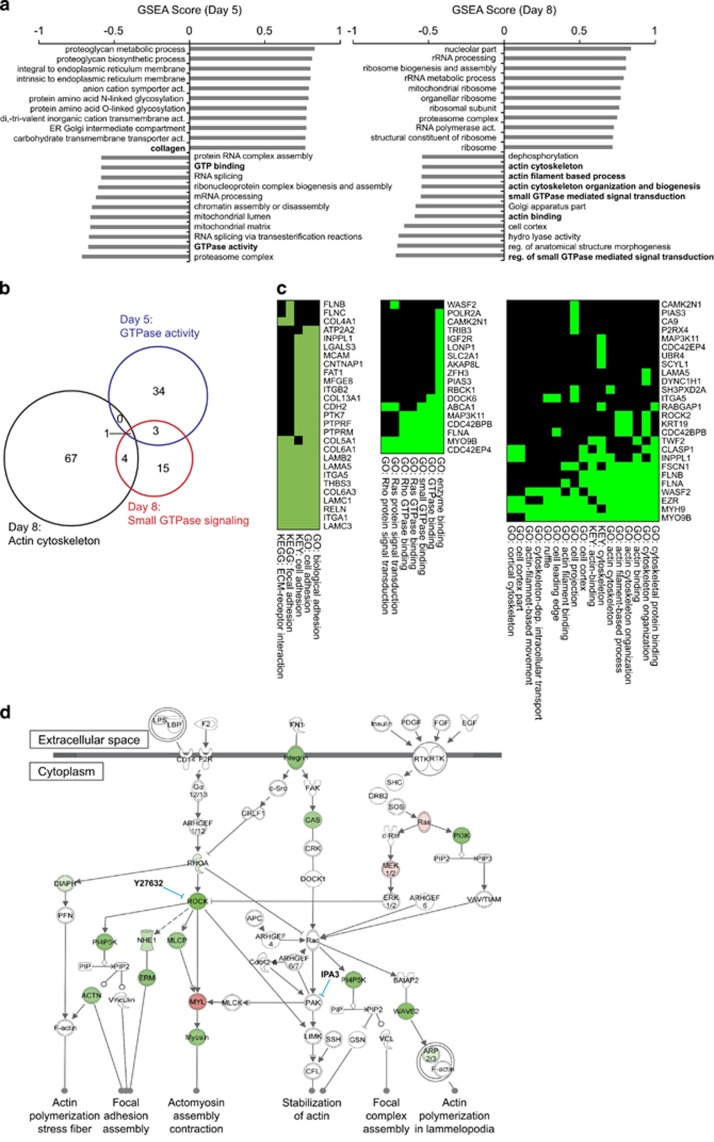
Altered gene expression patterns in the absence of HSF2 in PrCa organoids. PC3 cells were transfected with scrambled control siRNA or siRNA against HSF2. Total RNA was purified at day 5 or 8 from triplicate cultures of PC3 organoids, RNA was hybridized to Illumina micorarrays and the relative gene expression was analyzed. (a) Gene set enrichment analysis (GSEA) of mRNA expression data of PC3 organoids at day 5 or 8 in 3D culture. Values indicate relative enrichment of gene sets after HSF2 silencing compared with control. The complete list of GO terms is shown in Supplementary Table 2. Enrichment plots for selected GO terms is shown in Supplementary Figure S3b. (b) Venn diagram of the overlap of genes related to G-protein signaling (GTPase activity, small GTPase-mediated signal transduction and regulation thereof) and actin cytoskeleton (actin cytoskeleton, actin filament-based processes, actin cytoskeleton organization and biogenesis and actin binding), differently expressed in PC3 organoids upon HSF2 silencing at day 5 or 8 in 3D culture. The number of altered genes, both pathway specific and shared between the pathways, upon HSF2 silencing, is indicated inside the circles. The figure was constructed using Biovenn bioinformatics tool.59 (c) Gene term heatmaps generated in the DAVID analysis tool from the top 300-ranked target genes. Focal adhesion (left panel) gene clusters were enriched at day 5 and RHO GTPase (middle panel) and actin cytoskeleton-related gene clusters (right panel) at day 8 upon HSF2 silencing. Green areas show common annotations between terms and genes. (d) Schematic illustration based on Ingenuity Pathway Analysis of genes in actin cytoskeleton signaling. HSF2 silencing interfered with the actin cytoskeleton signaling by regulating genes at various levels, as revealed by microarray analysis. Genes affected by HSF2 knockdown in invasive 3D structures at day 8 are shown in red (upregulated) and green (downregulated). The small molecular inhibitors used in Figure 6b are indicated in blue. Act, activity; dep, dependent; GO, GO terms; KEGG, kegg pathways, KEY, keywords, reg, regulation.

