Figure 7.
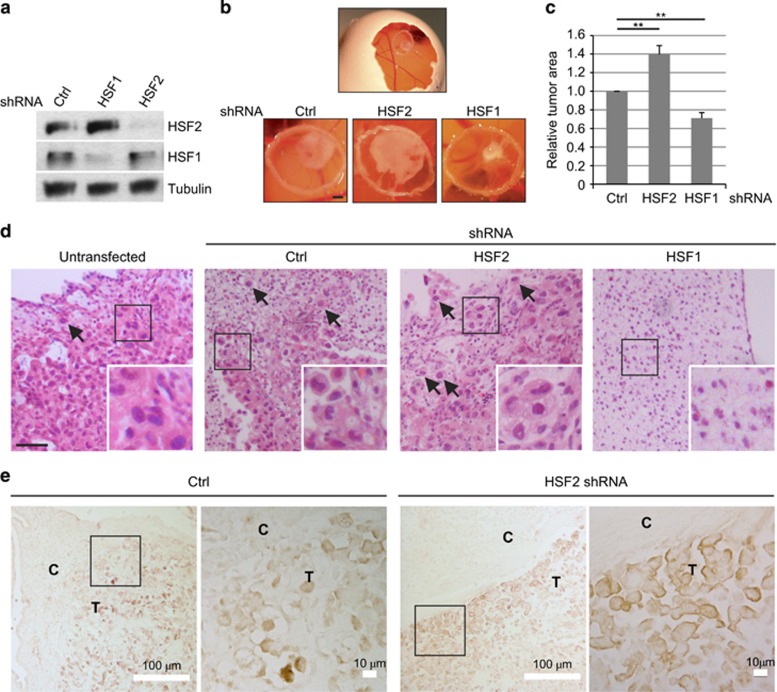
Silencing of HSF2 increases in vivo tumor growth in the CAM model. PC3 cells were transfected with indicated shRNA constructs to silence either HSF2 or HSF1 and assayed 3 days after that 1 × 10⁶ cells were implanted on CAM. (a) The protein expression of shRNA-transfected cells was examined 4 days after transfection by western blotting against HSF2 and HSF1. Tubulin was used as a loading control. (b) Images of representative tumors on the CAM. Upper panel: overview image of the control (Ctrl)-treated egg. Lower panel: the implantation area is confined by a plastic ring, inside of which the tumors are located. Scale bar, ~1 mm. (c) Relative tumor area was determined using ImageJ. The area of the control-transfected tumor (Ctrl) was arbitrarily set to 1. Results are from four independent experiments, each with 3–5 eggs per shRNA construct. Error bars indicate s.e.m. **P-values <0.05 by Student's t-test. (d) Representative images of HE-stained primary tumors either non-transfected or transfected with the indicated shRNA. HSF1 silencing caused almost complete abolishment of PC3 tumors. Cells escaping from the primary tumor site were most frequently detected after HSF2 depletion as indicated by arrows. The insets show blow-ups. Scale bar, 50 μm. (e) Representative immunohistochemistry (IHC) images of sections stained against human MMP14 after transfection with control (Ctrl) or HSF2-targeting shRNA constructs. In each image, both the PC3-derived tumor (T) and chicken-derived CAM (C) are shown. In the image pairs, the blow-ups (right) represent the framed area (left).

