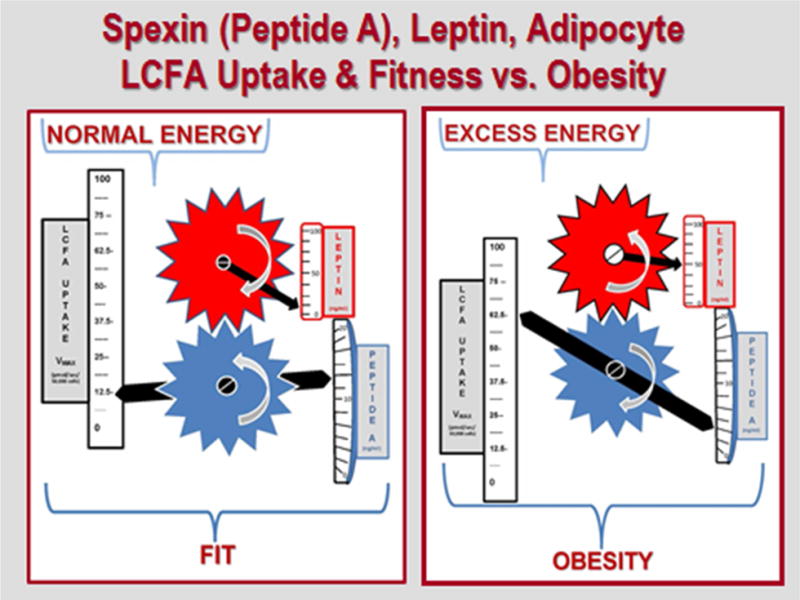
Figure 4. Relationships between plasma levels of Spexin (Peptide A) and leptin and adipocyte LCFA uptake.

Left-hand panel illustrates these relationships in the presence of normal energy balance and physical fitness: low levels of leptin and LCFA uptake Vmax, high evels of Spexin. Right hand panel reflects the situation in the presence of excessive energy, leading to obesity: higher levels of leptin and increased LCFA uptake Vmax, low levels of spexin. The interlocking gears illustrate the strong, negative correlation between plasma Spexin and leptin concentrations, and their respective relationship to the Vmax for adipocyte LCFA uptake.
