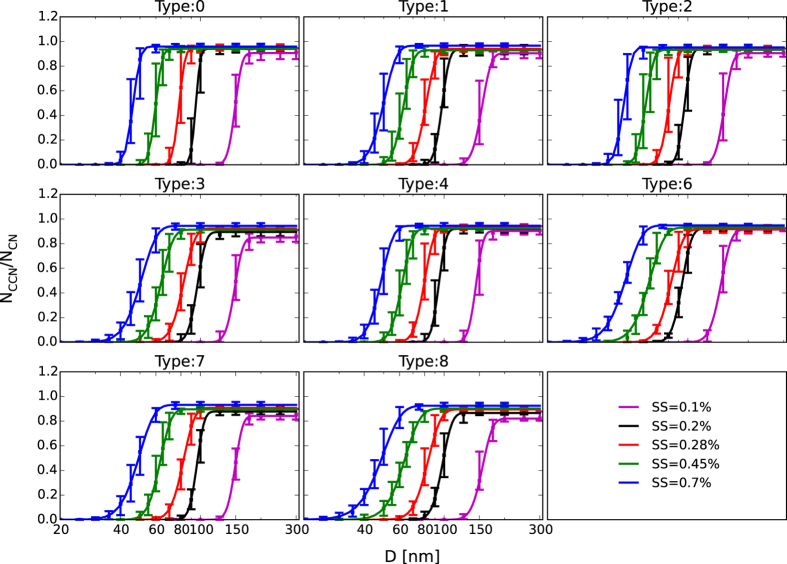
Figure 3. Averaged CCN activation spectra under different weather-pollution conditions.
The data points are the median value of all measured spectra during the weather type, the lower and upper bars represent the quartile error, and the lines are derived from three-parameter CDF (Gaussian distribution function) fitting.

