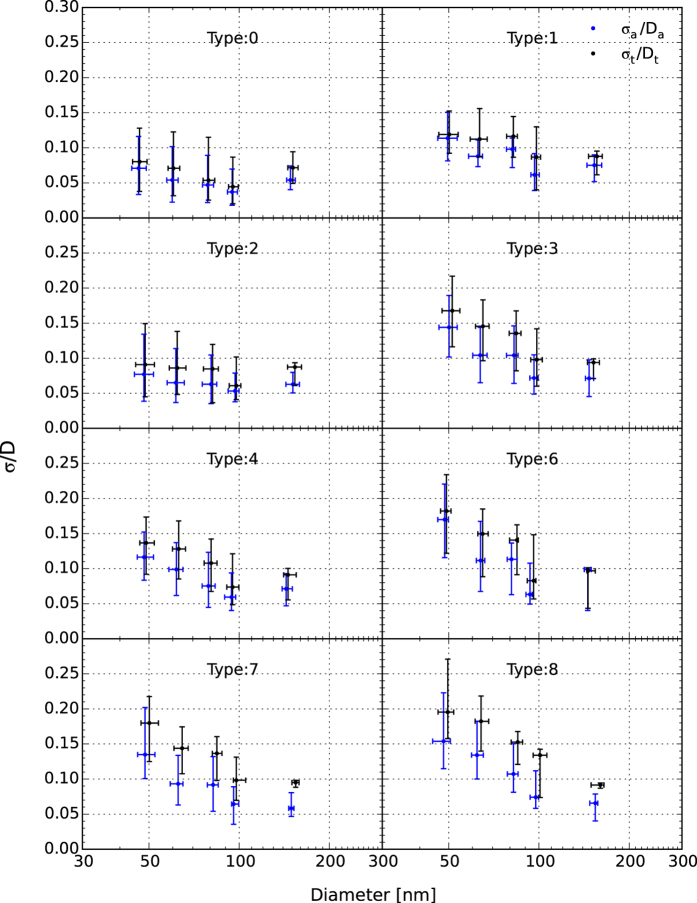
Figure 4. The averaged heterogeneous parameters (σa/Da, σt/Dt) derived from CCN activation spectra under different weather-pollution types plotted against the critical diameter (Da or Dt, respectively).
The data points are the median value corresponding to the weather-pollution type and given supersaturation, and the lower and upper bars represent the quartile error.

