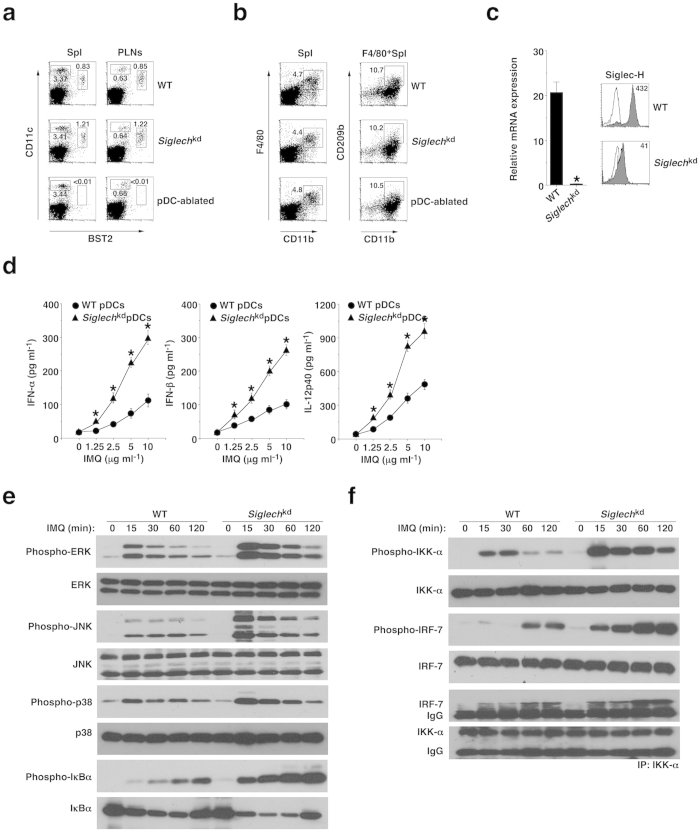
Figure 1. Deficiency of Siglec-H and ablation of pDCs in Siglechdtr/dtr mice.
(a) The frequency of CD11c+BST2+ pDCs in Spl and PLNs obtained from the C57BL/6-background WT mice (n = 3), Siglechkd mice (n = 3), and pDC-ablated mice (n = 3) was analyzed by flow cytometry. Data are presented as a dot plot, and numbers represent the proportion of CD11c+BST2+ pDCs among leukocytes in each quadrant. (b) The frequency of CD11b+F4/80+CD209b+ macrophages in Spl obtained from WT mice (n = 3), Siglechkd mice (n = 3) and pDC-ablated mice (n = 3) was analyzed by flow cytometry. Data are presented as a dot plot, and numbers represent the proportion of CD11b+F4/80+ macrophages among leukocytes (left panel) and CD11b+CD209b+ macrophages among F4/80+ macrophages (right panel) in each quadrant. (c) Transcriptional expression (left panel) or cell surface expression (right panel) of Siglec-H in pDCs obtained from WT mice (n = 3) and Siglechkd mice (n = 3) was measured by quantitative reverse transcriptase (RT)-PCR or flow cytometry. (Left panel) Data are the mean ± s.d. from three individual samples in a single experiment. (Right panel) Data are presented by a histogram, and numbers represent mean fluorescence intensity (MFI). (d) pDCs obtained from WT mice (n = 3) and Siglechkd mice (n = 3) were stimulated or not stimulated with IMQ, and the production of cytokines was measured by enzyme-linked immunosorbent assay (ELISA). Data are the mean ± s.d. from three individual samples in a single experiment. *P < 0.01 compared with WT mice. (e,f) pDCs obtained from WT mice (n = 3) and Siglechkd mice (n = 3) were stimulated or not stimulated with IMQ for the period indicated, at which time cells were lysed. Total lysate or the immunoprecipitate with anti-IKK-α Ab prepared from the pooled pDCs (each n = 3) was analyzed using Ab specific for ERK (e), JNK (e), p38 (e), IkBα (e), IKK-α (f) and IRF-7 (f), or for phosphorylated versions of these proteins. IP, immunoprecipitation. *P < 0.01 compared with WT mice. All data are representative of at least three independent experiments.

