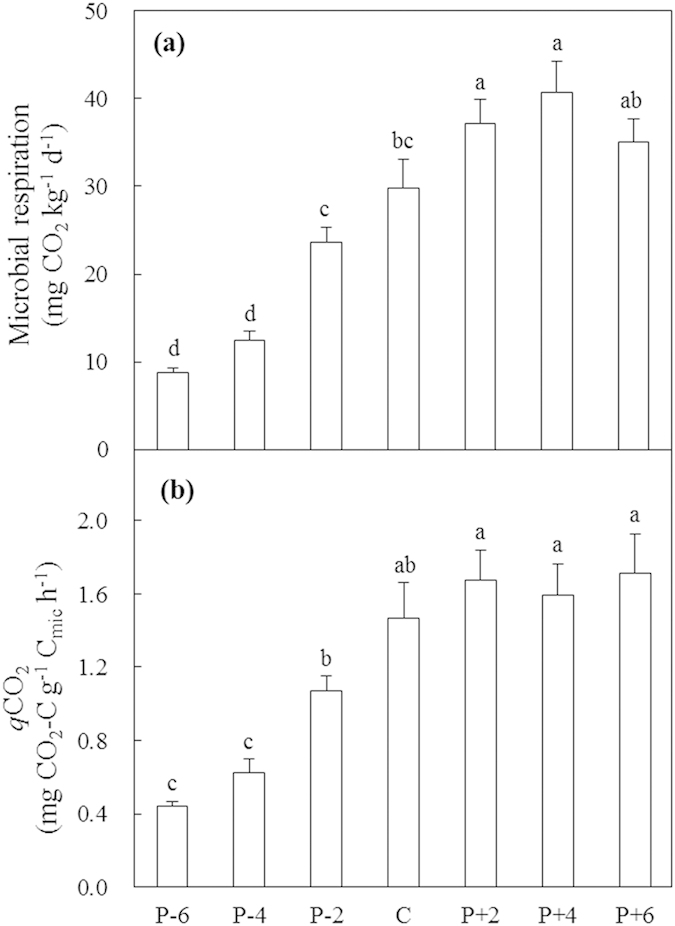
Figure 4.

Microbial respiration (a) and metabolic quotient (qCO2, (b) in 2012 along the precipitation gradient. Values are means ± S.E., n = 6. P-6, P-4, P-2, C, P + 2, P + 4, and P + 6 represent −60%, −40%, −20%, control (ambient), +20%, +40%, and +60% precipitation, respectively. Means with the same letter are not significantly different (P > 0.05).
