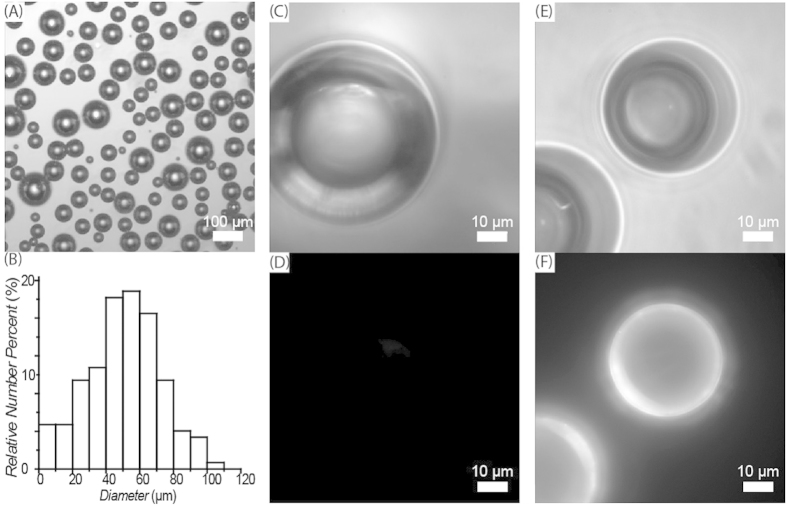
Figure 3.
(A) Bright field image of micro-bubbles. (B) Size distribution of micro-bubbles, measured by microscopic imaging. (C) Bright field and (D) fluorescence images of BSA modified micro-bubbles labelled with biotinylated fluorescent reporters (biotin-M13-Alexa555). (E) Bright field and (F) fluorescence images of NeutrAvidin modified micro-bubbles labelled with biotinylated fluorescent reporters (biotin-M13-Alexa555).

