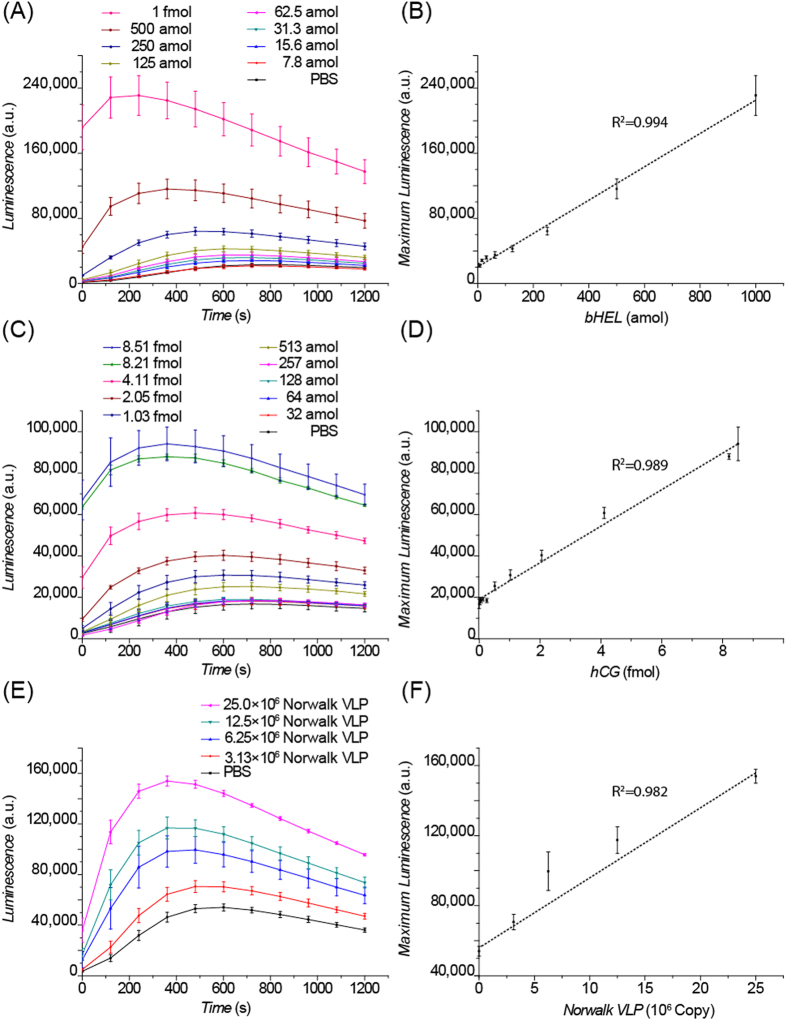
Figure 4.
(A) Signal profiles of the Flotation Immunoassay (FI) for the detection of biotinylated lysozyme (bHEL). (B) Linear response of the maximum chemiluminescence (CL) signal to the amount of bHEL. (C) Signal profiles of the FI for human chorionic gonadotropin (hCG) detection. (D) Linear response of the maximum CL signal to the amount of hCG. (E) Signal profiles of the FI for Norwalk VLP detection. (F) Linear response of the maximum CL signal to the amount of Norwalk VLP. Mean ± standard deviation; n = 3.

