
Figure 2. Relationship between manipulation complexity and ln (brain size), for various types of substrate use (raw species values, blue = terrestrial, green = partly terrestrial, red = arboreal) shown for visualisation purpose.
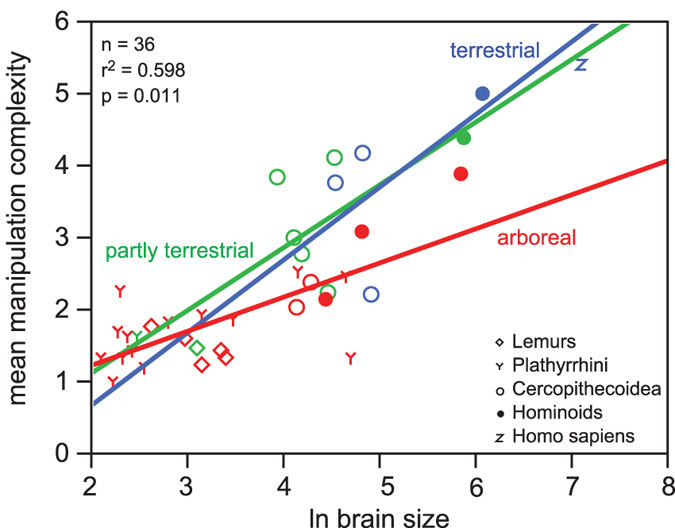
Species values are listed in Supplementary Table S1. Homo sapiens is not included in the calculation of the correlation and is only shown for illustrative purposes. Statistics see Table 2.