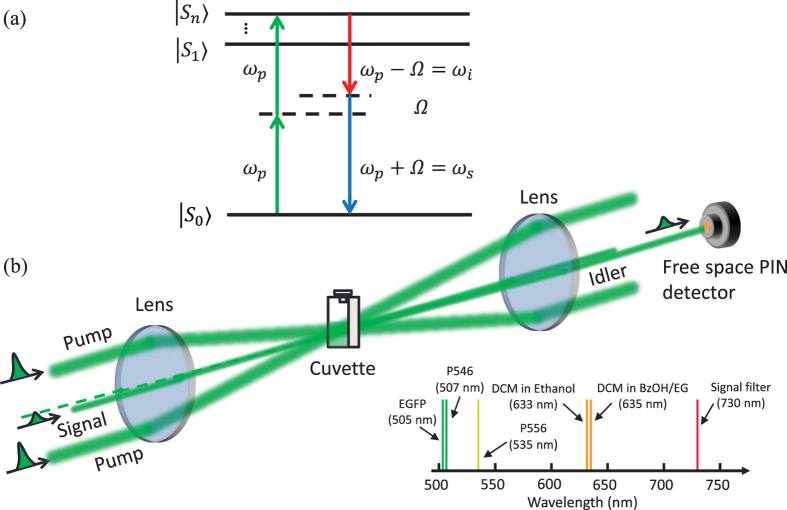
Figure 1.
(a) The energy diagram of the eGFP. Four-wave mixing process on the excited vibronic states (Sn, S1) and the ground state (S0) of the eGFP. (b) A pump-probe configuration setup for measuring the conversion efficiency of four-wave mixing process. Inset: the locations of fluorescence peak of each sample and the signal filter. P556(pyrromethene 556), P546(pyrromethene 546).

