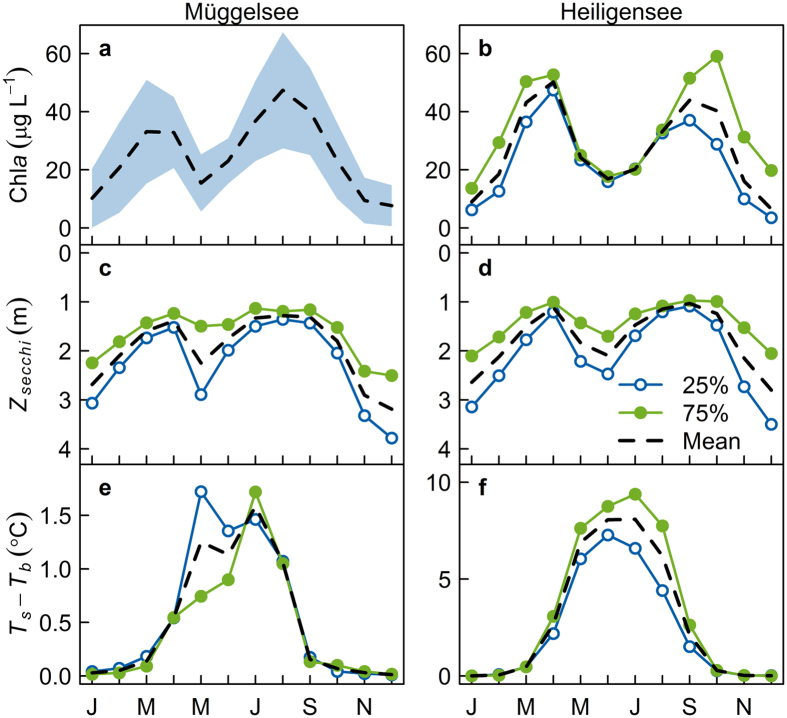
Figure 2. Mean seasonal pattern of chlorophyll a (Chla, (a,b)), Secchi transparency (Zsecchi, (c,d)) and stratification strength (Ts − Tb, (e,f)) in Müggelsee (a,c,e) and Heiligensee (b,d,f).
Dashed lines show long term monthly means, lines with symbols show how the first (b,c,d,f) or second principal component (e) affect the mean seasonal pattern. Open symbols show a low score of the respective principal component (25th percentile in the time series) and closed symbols show a high score (75th percentile). Seasonal patterns represented by like symbols in each lake are correlated. The scores for Chla in Müggelsee are not shown because they were not correlated with Zsecchi or Ts − Tb; instead the shaded region in (a) represents 1 standard deviation from the mean. Note reversed y-scale for Zsecchi reflecting depth measured downwards.

