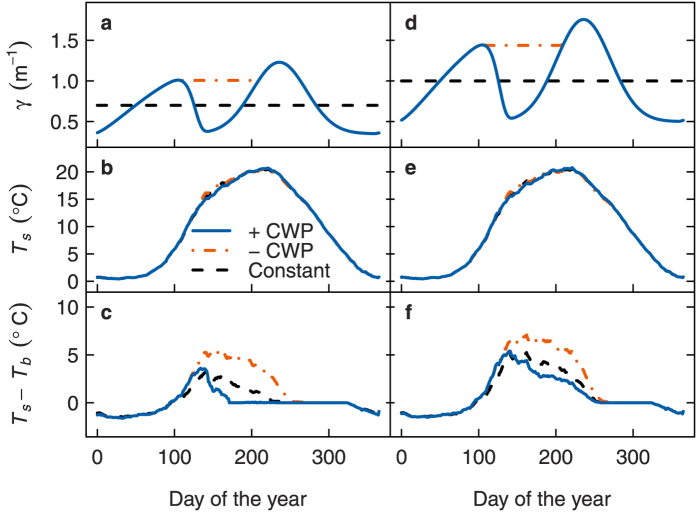
Figure 7. Seasonal development of mean simulated lake thermal characteristics, comparing constant extinction (dashed lines) and seasonally variable extinction scenarios with a clear water phase (CWP, solid lines, = 0.7 m−1 (a,b,c) or 1.0 m−1 (d,e,f)) and without a CWP (dot-dashed lines,
  = 0.8 m−1 (a,b,c) or 1.1 m−1 (d,e,f)).
γ: extinction, Ts: surface temperature, Tb: bottom temperature.

