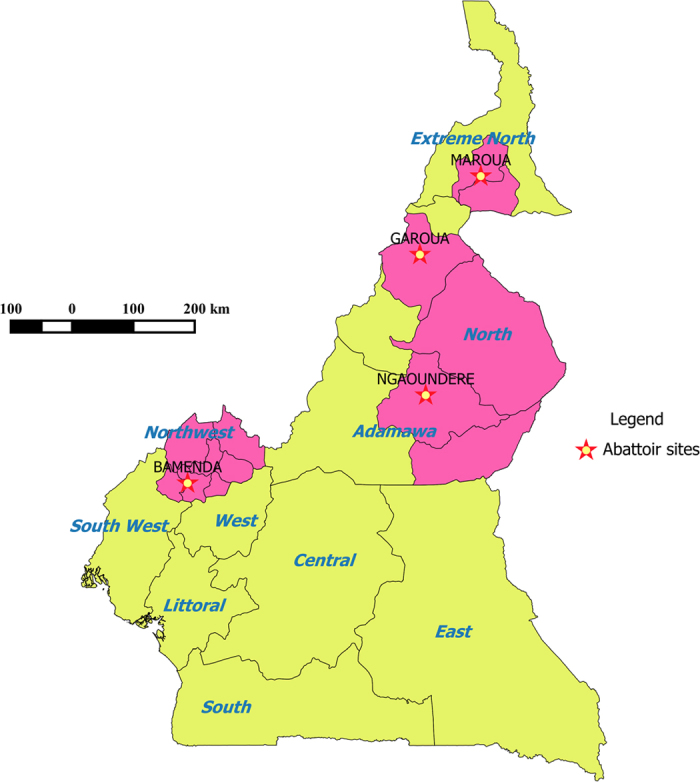
Figure 1. Map of Cameroon showing the 4 administrative Regions covered by the study and the location of the 4 municipal abattoirs where sampling took place (star).

(Northwest Region, Adamawa Region, North Region and Extreme North Region). The pink areas are the lower administrative areas supplying cattle to these 4 abattoirs (Generated using QGIS 2.2® (www.qgis.org) and shp files obtained from the GADM database of Global Administrative Areas (www.gadm.org)).
