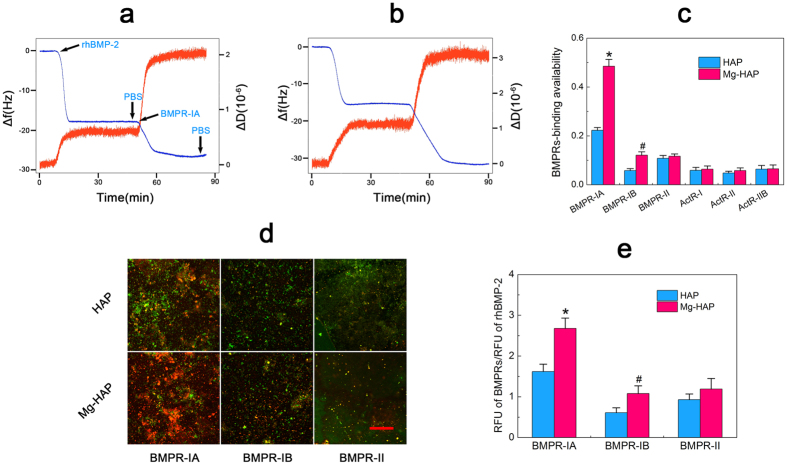
Figure 3.
Typical changes in Δf (blue line) and ΔD (red line) recorded against time during the adsorption of rhBMP-2 and subsequent binding of BMPR-IA on (a) the HAP surface and (b) the Mg-HAP surface. (c) Calculated BMPRs-binding availability by adsorbed rhBMP-2 on the HAP and Mg-HAP surfaces. Values are shown as mean ± standard error of the mean from 5 data points (n = 5). *p < 0.05, #p < 0.05, compared with the HAP surface. (d) CLSM observation of the fluorescent staining of adsorbed rhBMP-2 (green) and subsequent recruited BMPRs (red) on the HAP and Mg-HAP surfaces. Scale bar is 50 um. (e) The RFU (relative fluorescence units) of BMPRs per RFU of rhBMP-2. Values are shown as mean ± standard error of the mean from 50 data points (n = 50). *p < 0.05, #p < 0.05, compared with the HAP surface.

