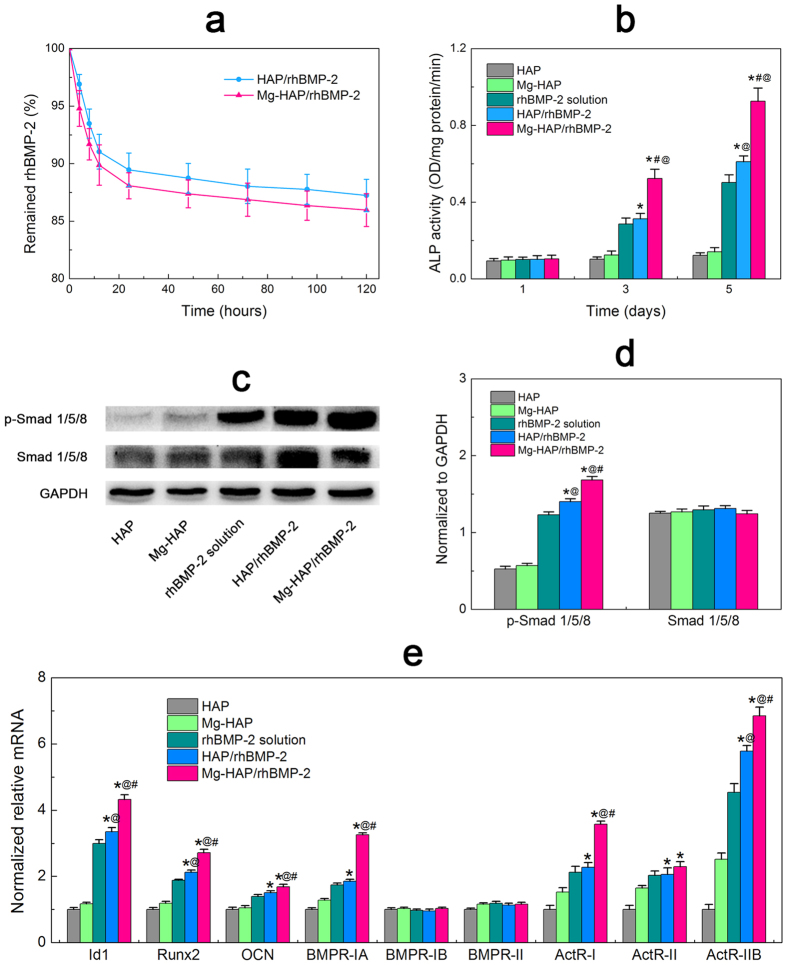
Figure 4.
(a) Remained rhBMP-2 on the HAP and Mg-HAP surfaces. Values are shown as mean ± standard error of the mean from 6 data points (n = 6). (b) ALP activity assay. The HAP and Mg-HAP surfaces without rhBMP-2 were acted as negative controls. The rhBMP-2 solution representing culture medium containing fresh rhBMP-2 at the similar content to that calculated from the QCM-D study was used as a positive control. (c) Western blot of p-Smad1/5/8, Smad1/5/8, and GAPDH for C2C12 cells cultured on respective surfaces. (d) Relative expressions of p-Smad1/5/8 and Smad1/5/8 (data are normalized to the total GAPDH content). Values are shown as mean ± standard error of the mean from 5 data points (n = 5). (e) Real time PCR results of expression of rhBMP-2-mediated genes and BMPRs genes on different samples. Values are shown as mean ± standard error of the mean from 5 data points (n = 5). *p < 0.05, compared with the corresponding surfaces without rhBMP-2; #p < 0.05, compared with HAP/rhBMP-2; @p < 0.05, compared with rhBMP-2 solution.

