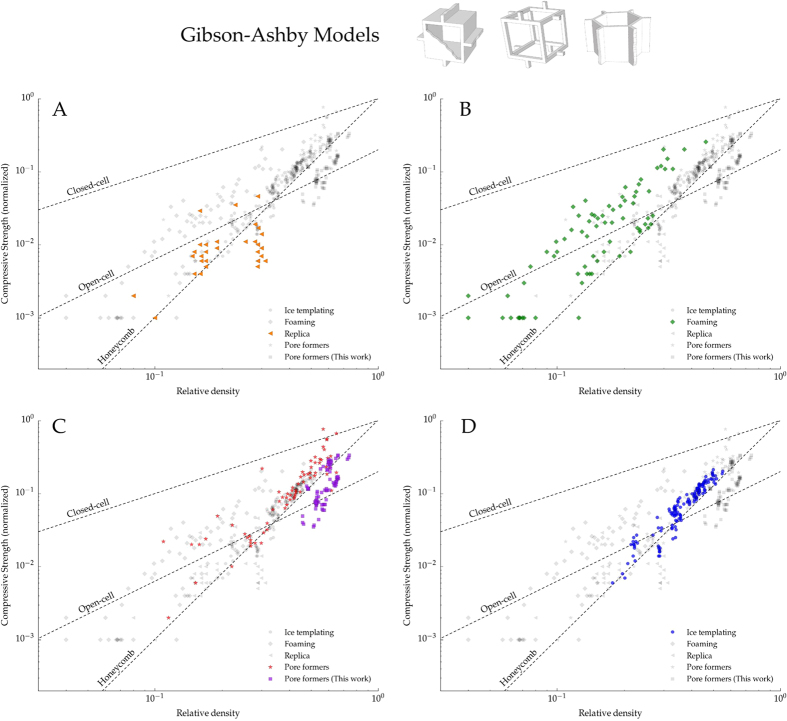
Figure 3.
Each plot in the panel highlights the compressive strength data versus relative density for four different macroporous ceramics processed by: (A) Replica, (B) Foaming, (C) Pore formers, and (D) Ice-templating. The experimental points of the other techniques are also shown in grey for comparison. The dotted lines represent the models proposed by Gibson and Ashby: Closed-cell (Eq. 3), Open-cell (Eq. 4), and Honeycomb out-of-plane (Eq. 5). Blue points in (D) and purple in (C) correspond to experimental points obtained in this work and the rest have been extracted from29.

