Figure 3. Protein expression profile.

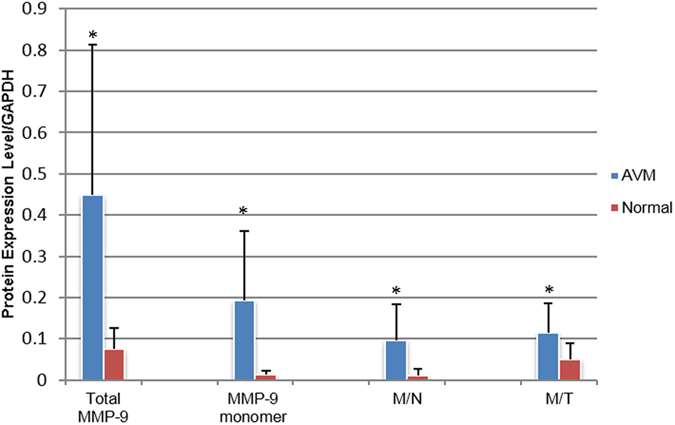
Comparison of protein expression levels of MMP-9 and its complexes between AVMs versus normal tissues. *significant difference; M/T, MMP-9/TIMP-1 complex; M/N, MMP-9/NGAL complex.

Comparison of protein expression levels of MMP-9 and its complexes between AVMs versus normal tissues. *significant difference; M/T, MMP-9/TIMP-1 complex; M/N, MMP-9/NGAL complex.