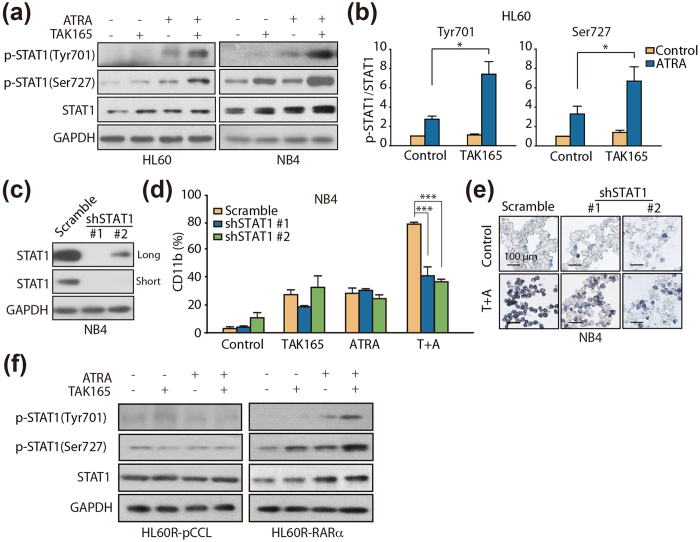
Figure 5. Effect of TAK165 and ATRA on STAT1 activation.
(a) Western blot analysis of p-STAT1 (Tyr701 and Ser727) and STAT1 in the HL60 and NB4 cells. The cells were treated with TAK165 (100 nM for HL60, 50 nM for NB4) and ATRA (1 μM for HL60, 2 nM for NB4) for 3 days. (b) The relative phosphorylation level of STAT1 at Tyr701 and Ser727 in the HL60 cells, were evaluated by p-STAT1 (Tyr701 or Ser727)/STAT1. (c) STAT1 expression in the NB4-scrambleand NB4-shRNA-STAT1 cells was measured by western blot. (d) CD11b expression in the NB4-scrambleand NB4-shRNA-STAT1 cells. The cells were treated with 50 nM TAK165 and 2 nM ATRA for 3 days. The data presented are the mean ± SD. ***p < 0.001. (e) NBT-reducing activity in the NB4-scrambleand NB4-shRNA-STAT1 cells. The cells were treated withTAK165 (50 nM) and ATRA (2 nM) for 3 days. (f) p-STAT1 (Tyr701 and Ser727) and STAT1 expression in the HL60R-pCCL and HL60R-RARα cells. The cells were treated withTAK165 in the presence of vehicle or 1 μM ATRA for 3 days.

