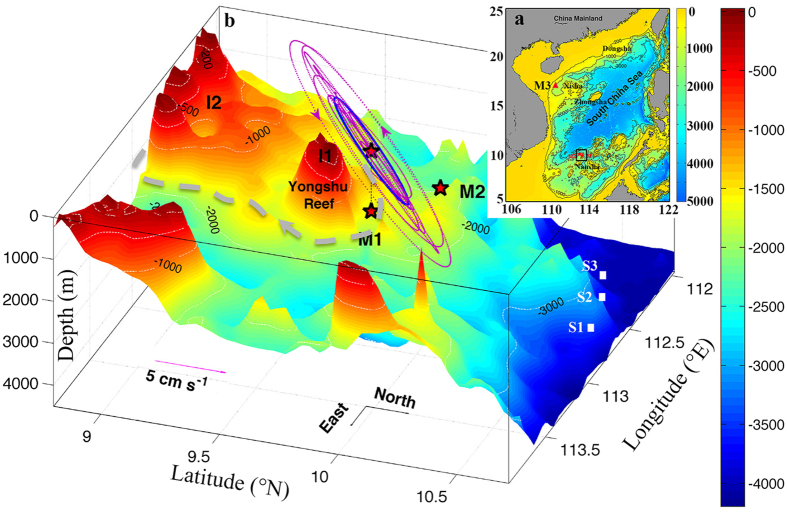
Figure 1. Bathymetry of the SCS.
(a) The SCS topography; (b) three-dimensional zoomed in view of topography of the area inside the box in (a). The two stars in each subplot represent moorings 1 (M1) and 2 (M2). The triangle in (a) is an Aanderaa (M3) current meter moored in the Xisha islands area. The scatterplot (magenta dots) of zonal and meridional TRW velocities at 1730 m from 1 February to 30 May 2013 is shown in (b); it is projected to the surface plane for visual clarity. The blue line is the standard deviation ellipse of the TRW velocities. The “I1” and “I2” in (b) represent two islands. The three white squares denote the CTD stations from WOD, and the grey dashed line indicates a possible path of the TRWs. The colour maps indicate the water depth (unit: m). Maps were generated by using MATLAB.

