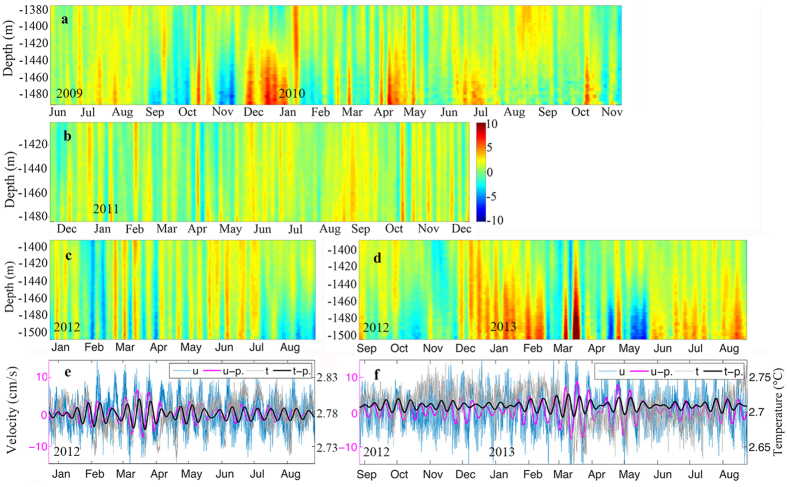
Figure 2. Deep-layer current observations.
Observed near-bottom zonal velocity at M1 (unit: cm/s). (a–d) Time series of 3 day low-pass filtered zonal current profiles from the four segments of ADCP observations. Time series of the raw zonal velocity (cyan line) and temperature (grey line) obtained by the Aanderaa current meter at 1730 m (20 m above the bottom) (e) from December 23, 2011 to August 26, 2012 and (f) from August 27, 2012 to August 23, 2013. The solid heavy black and magenta lines represent the 9–14 day band-pass filtered zonal velocity and temperature, respectively. Figures were plotted using MATLAB.

