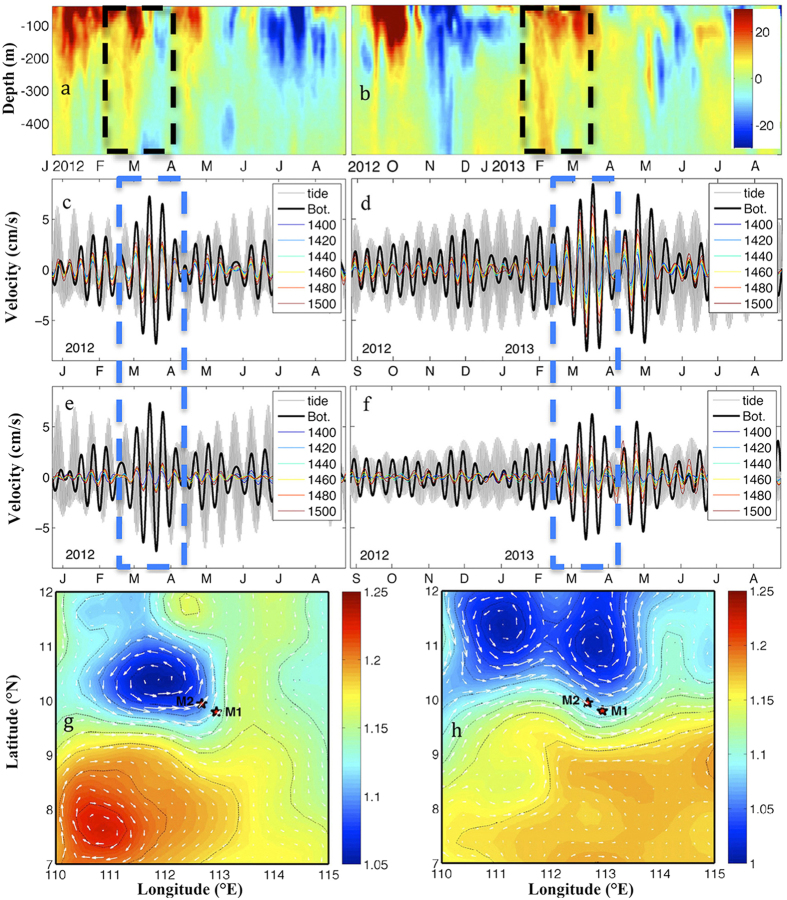
Figure 4. Currents in the upper layers, TRWs, and surface satellite observations.
(a,b) Upper layer zonal velocity profiles at M1 (unit: cm/s); 9–14 day band-pass filtered deep layer (c,d) zonal and (e,f) meridional velocities (unit: cm/s); the monthly absolute dynamic topography and surface geophysical current in February (g) 2012 and (h) 2013. The grey lines are the zonal (c,e) and meridional (d,f) tidal currents at 1730 m. Maps were generated by using MATLAB.

