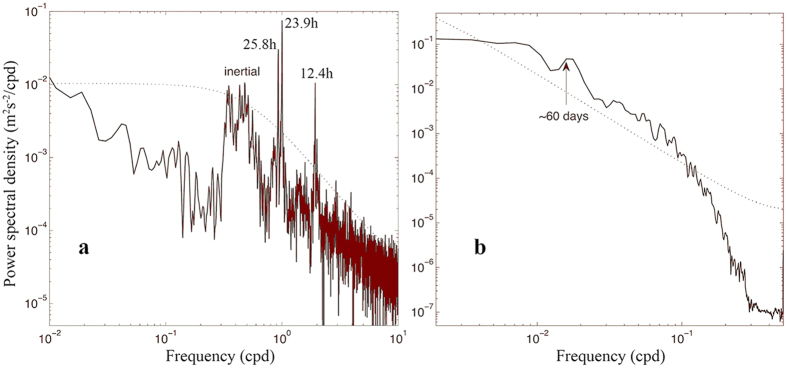
Figure 5. Power spectra of the upper layer velocity at M1 and bottom velocity at M2.
(a) Power spectrum derived from the near-bottom zonal velocity at M2 observed between August 25, 2013 and September 22, 2014. (b) Power spectrum of the vertically averaged zonal velocity between 40 and 450 m at M1 from May 24, 2009 to August 23, 2013, for which a 3-day low-pass filter was used at first. Dotted lines represent a significance level of 95%. Figures were plotted using MATLAB.

