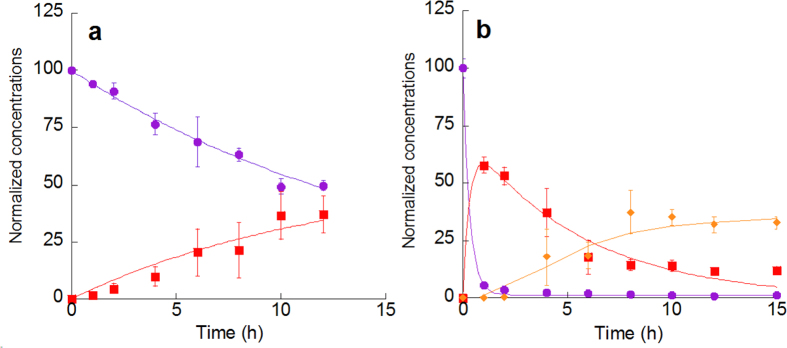
Figure 1.
Concentrations of Py and nitropyrenes (1-NP and DNPs) on quartz (a) and CDD (b) (expressed as a percent of the initial Py concentration) after exposure to 3 ppmv NO2 for the indicated times. The data points represent mean values (±1 SD) of triplicate experiments: circles, Py; squares, 1-NP; diamonds, DNPs (=1,3-DNP + 1,6-DNP + 1,8-DNP). The curves for Py decay are exponential nonlinear least-squares fits assuming first-order reactions. See Methods for details. The curves for nitropyrene formation are for illustrative purposes only.

