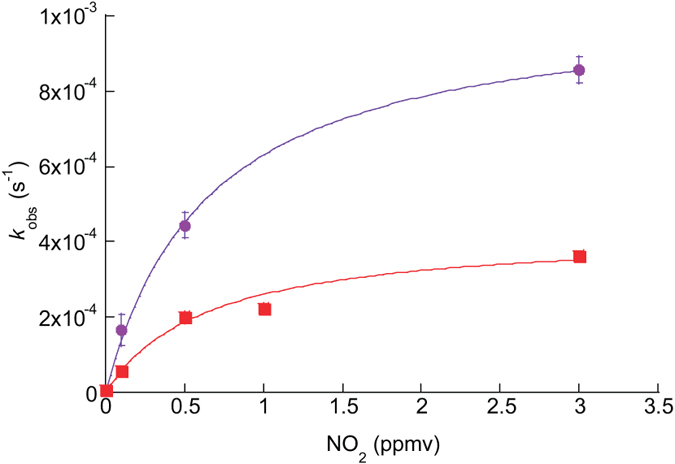
Figure 3. Pseudo-first order rate coefficient (kobs) as a function of gas-phase NO2 concentration.

The curves are nonlinear least-squares fits based on Langmuir–Hinshelwood-type mechanism (equation (2)). The upper data set was for CDD, the lower one for ATD. The error bars represent one standard error derived from nonlinear least-squares fitting for the Py decay plots.
