
Figure 4. Atmospheric dust, PAHs, NO2 and 1-NP concentrations in Beijing in March 2010.
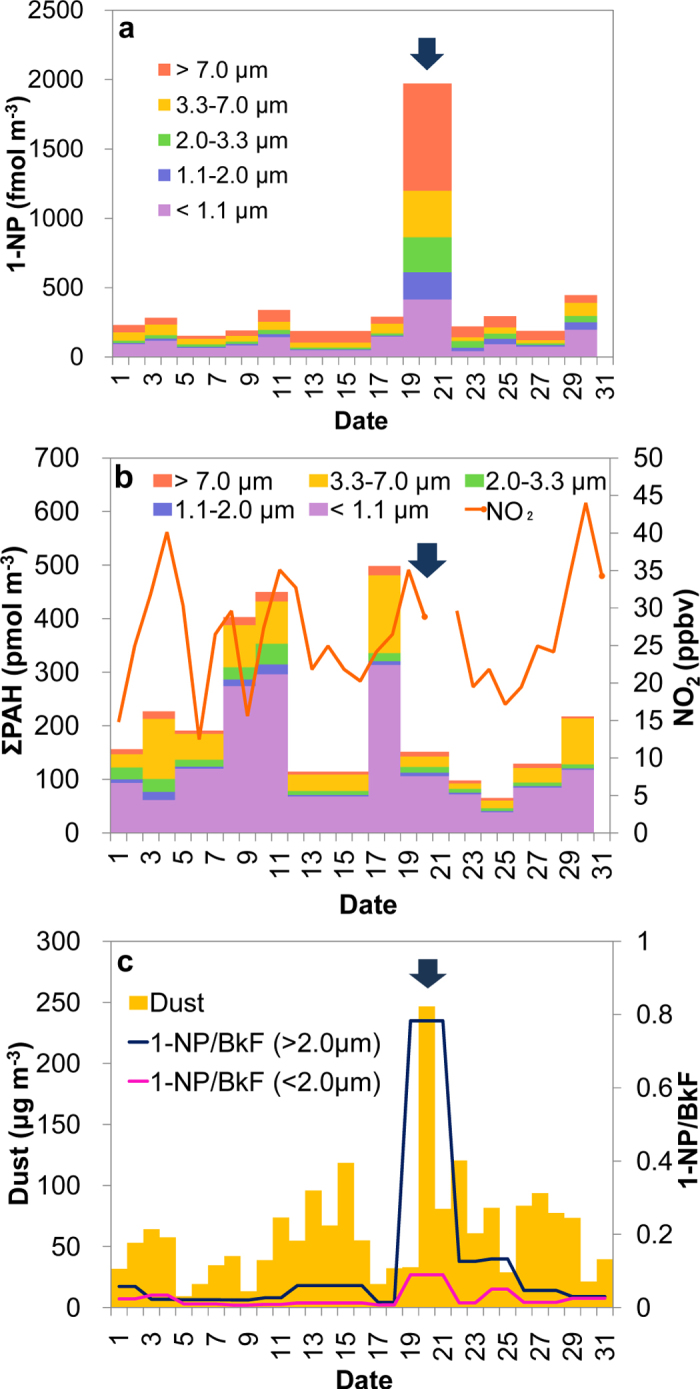
(a) Size-fractionated particle-bound 1-NP. (b) Gaseous NO2 and size-fractionated particle-bound PAHs. (c) Aeolian dust. Variation in concentration of 1-NP relative to that of BkF (1-NP/BkF) is also shown in (c). The daily mean concentrations of aeolian dust were obtained from the LIDAR DSS Observation Data Page52. The NO2 data was converted from the daily API value obtained from the website of the Beijing Public Net for Environmental Protection53. Arrows indicate a heavy dust period.