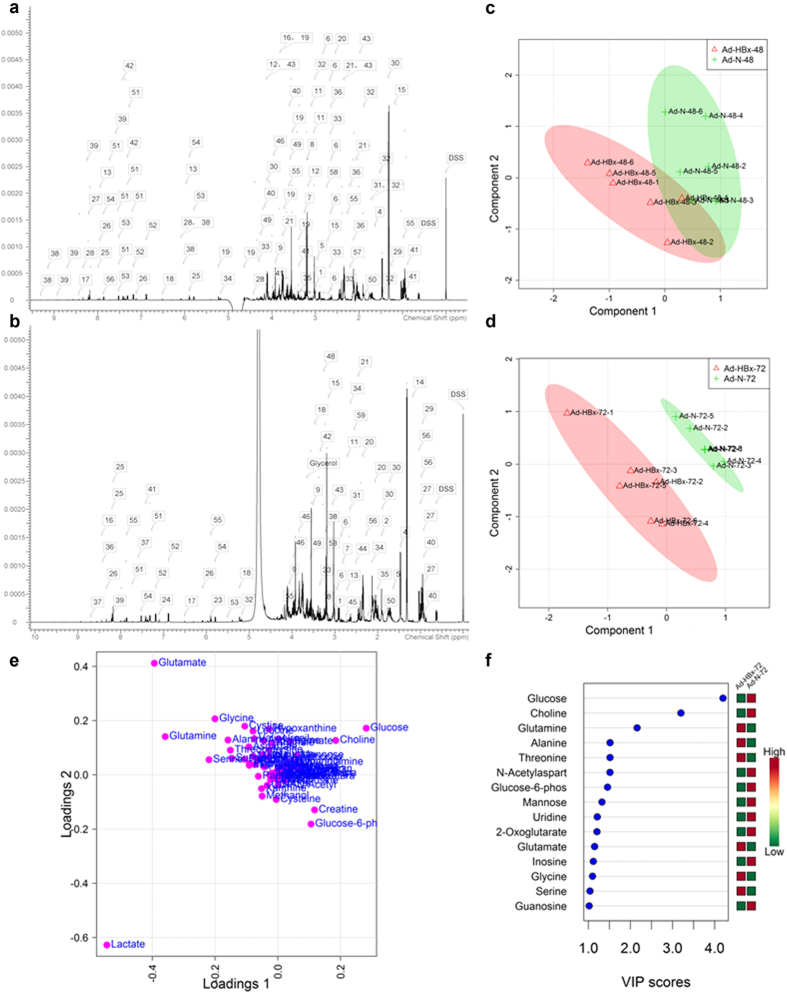
Figure 1. Representative 600-MHz 1H-NMR spectra and PLS-DA analysis of 1H-NMR spectral data.
(a,b) Respectively show the spectra (0–10 ppm) of HepG2 cells infected by Ad-N and Ad-HBx, which included all metabolites identified. (c,d) Show the PLS-DA scores plots. (c) Ad-HBx-48 (red triangles) versus Ad-N-48 (green crosses) (R2 = 0.994 and Q2 = 0.447); (d) Ad-HBx-72 (red triangles) versus Ad-N-72 (green crosses) (R2 = 0.997 and Q2 = 0.743). The values of R2 and Q2 represent the goodness of fit and predictability of the models, respectively. (e) Loadings plot of 72 h post-infection from the PLS-DA analysis. (f) VIP scores of important metabolites. Red or green on the right indicates the low or high concentration of metabolites by comparing the concentration of each metabolite in Ad-HBx-72 and Ad-N-72.

