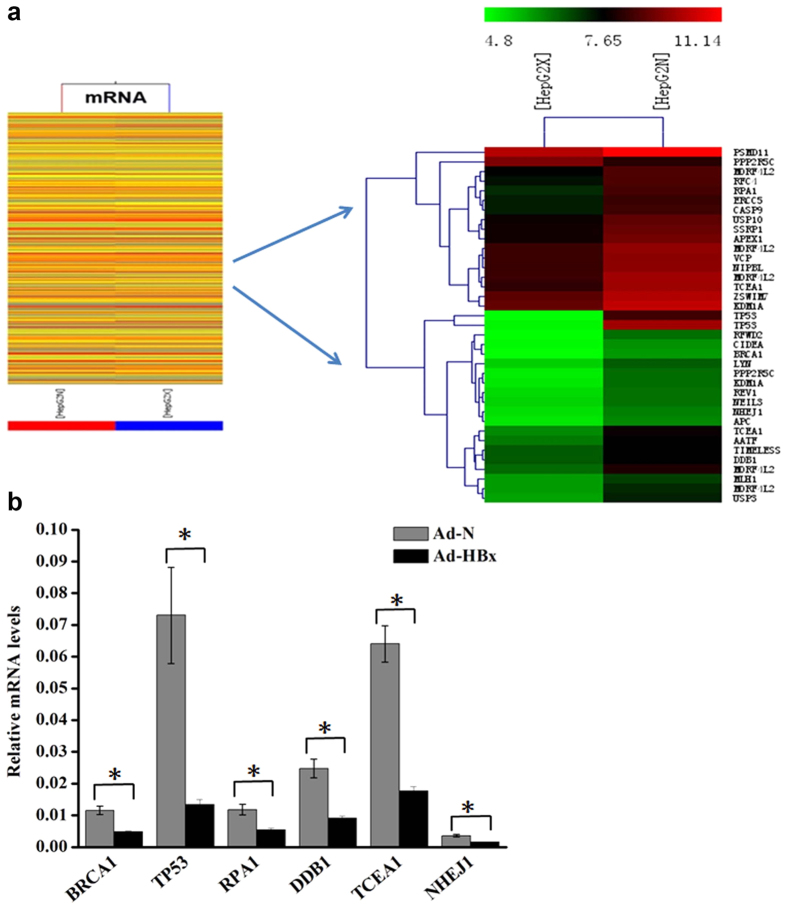
Figure 5. HBx affected gene expression profiles of cells.
(a) Shows the expression profiles of mRNA (left) and DNA damage-related genes (right). Green or red on the heat map indicated a decrease or an increase in the mRNA level and color intensities correspond to relative signal levels on a logarithmic scale. (b) qRT-PCR validation of representative mRNA. Data were normalized to GAPDH and represent the mean of three experimental replicates. *indicates a significant difference between cells infected Ad-N and Ad-HBx by Student’s t test (p < 0.05).

