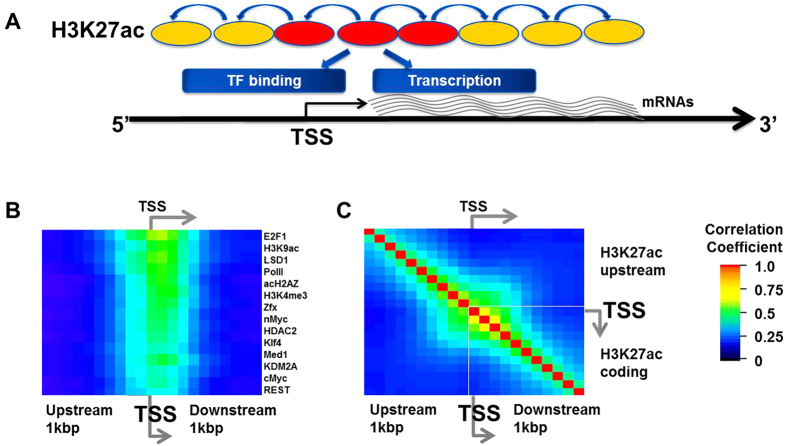
Figure 1. Finding representative DNA binding features of gene regulation in the coding region.
(A) H3K27ac peak at 5′ end of coding region (red oval) is a representative feature of gene regulation in mESC. The H3K27ac in the promoter and 5′ end of coding region correlates with adjacent H3K27ac (yellow ovals) and other transcription factor binding enrichment in the region. (B) H3K27ac in the 5′ end of genes significantly associates with binding of the transcription factors in the genes. Color map of correlation coefficients between H3K27ac at the 5′ end of genes and other transcription regulating protein factors at each position in 200 bp sliding window with 100 bp overlap around TSS; warm color represents high association, and blue and black colors represent low association in pair-wise manner. P-values for correlations of transcription regulator binding are all less than 10−22. (C) H3K27ac enrichment around transcription start sites associate with each other. Color map of pair-wise correlation coefficients between H3K27ac at 200 bp sliding window with 100 bp overlap in 2 kbp region around TSS.

