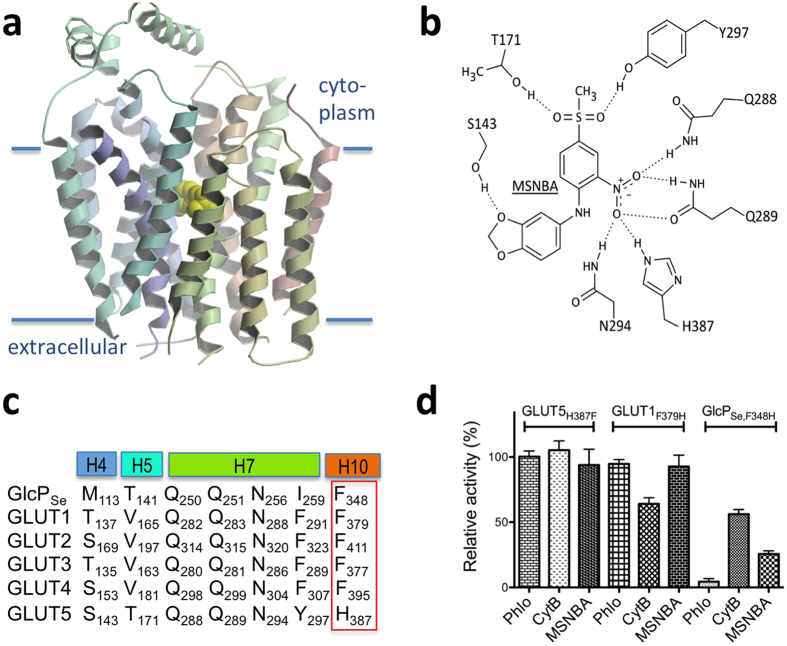
Figure 3. Modeled interaction of MSNBA with GLUT5.
(a) Binding of MSNBA (yellow CPK model) to the transmembrane site in GLUT5 as predicted by docking of the inhibitor to GLUT5 model with MOE. The figure was drawn with Molscript46 and raster3D47. (b) Interactions between MSNBA and side chains of GLUT5. Interacting residues come from helices 4 (S143), 5 (T171), 7 (Q288, Q289, N294 and Y297), and 10 (H387); see also Supplementary Fig. S4. (c) Multiple sequence alignment among GLUT homologues for the GLUT5 residues predicted to interact with MSNBA. H4, H5, H7 and H10 represent transmembrane helices 4, 5, 7 and 10, respectively, and are color-coded as in Fig. 3a. The red box highlights the residue explored by site-directed mutagenesis in GLUT1, GlcPSe and GLUT5. Alignment was generated with ClustalW48. (d) Effect of MSNBA and common GLUT1 inhibitors cytochalasin B (CytB) and phloretin (Phlo) on the relative transport activity of GLUT5H387F, GLUT1F379H or GlcPSe,F348H measured as in Fig. 1b except that for GlcPSe,F348H glucose concentration was 90 μM (corresponding to glucose KM for this mutant, Supplementary Fig. S5). All inhibitors were at 2 mM concentration.

