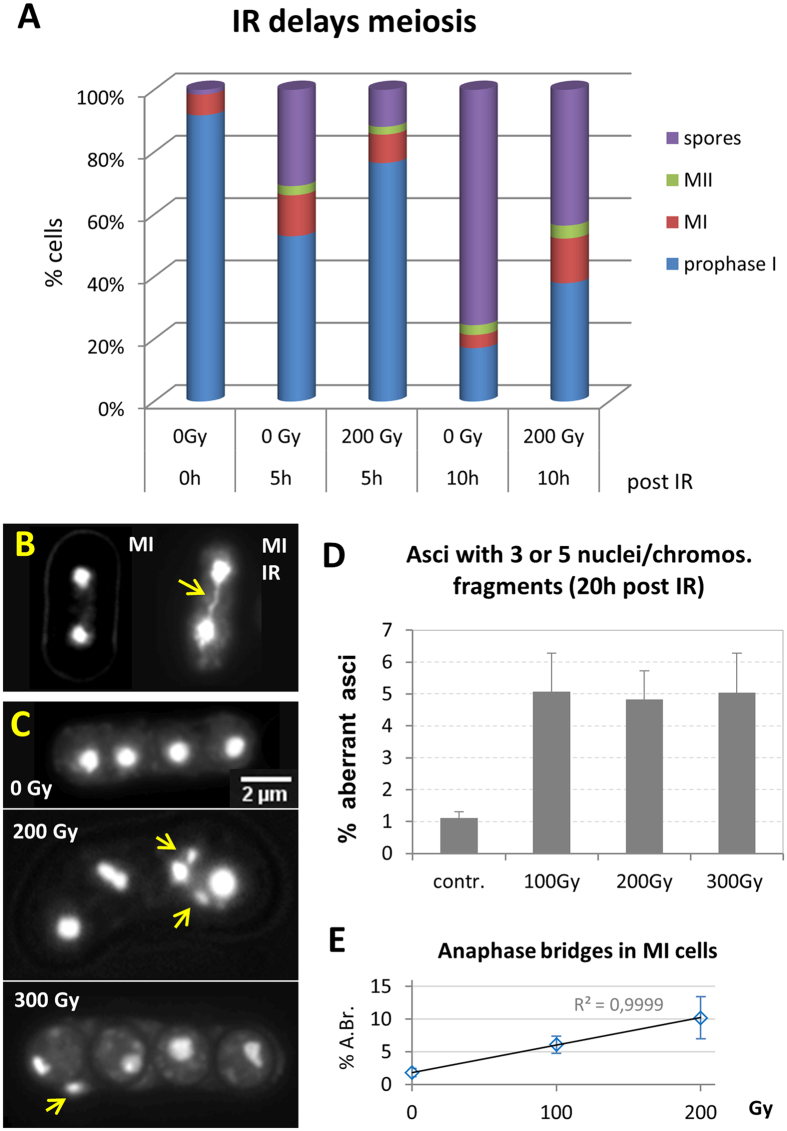
Figure 8. Metaphase progression is altered by IR.
(A) Proportion of Metaphase I (MI) and II (MII) cells and spores as determined by DAPI staining in sporulating cultures. Before irradiation (0 Gy, 0 h) 92% of cells were in prophase I and 6.7% of cells were in MI. Five h thereafter (0 Gy, 5 h), there were 53% prophase I cells, 13% MI, and 31% ascospores. Irradiation delayed prophase I progression in that 77% of cells still were in first meiotic prophase 5 h post IR (200 Gy, 5 h), as identified by horsetail morphology and Rec8-GFP expression. This was only the case for 53% of control cells. At 10 h post IR 38% of irradiated cells were still in prophase I, while this was only seen for 17% in the control (0 Gy, 10 h) where 74% of cells had formed spores. (B) DAPI image of anaphase I cells. The control (left) shows two nuclei (DNA: white) and the 200 Gy X-irradiated cell (right) displays a chromatin stretch between the daughter nuclei (arrow) indicative of an anaphase bridge likely caused by a dicentric chromosome, since the frequency of these cells increases with dose (below). (C) Ascospores without (0 Gy) and after irradiation. The 200 Gy ascospore below exhibits more than 4 nuclei, with the excess nuclei being smaller (arrows), being indicative of anaphase-lagging of acentric chromosome fragments due to unrepaired DSBs. The 300 Gy ascospore displays one chromosome fragment (arrow) outside the spore. (D) Frequency of asci with aberrant numbers of nuclei/chromosome fragments. Irradiation with 100–300 Gy X rays induced an average of 5% asci that displayed chromosomal fragments. (E) Percentage of Metaphase I (MI) cells with anaphase chromatin bridges (A.Br.; see B) without IR (n = 380 MIs analyzed) and after exposure to 100 Gy (n = 325) and 200 Gy X rays (n = 284). There is a linear increase with dose of about 2% anaphase bridges/50 Gy. Cells of three independent experiments were analyzed 5 h post IR; average ± SD shown.

