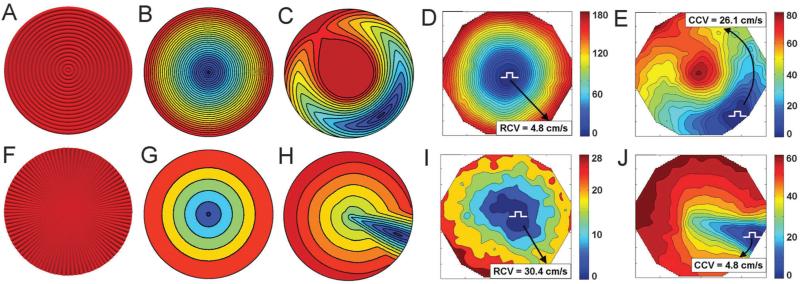
Fig. 8.
Contrasting modeling predictions and experimental analysis, based on the initial characterization in Fig. 7. (A) and (F) The geometry of the concentric and starburst fiber patterns based on the vector fields used to generate the corresponding patterns in Fig. 5; (B) and (G) simulations of action potential propagation following a point stimulus at the center of each monolayer pattern shown in (A) and (F) respectively; (C) and (H) simulations of action potential propagation following a point stimulus delivered off-center in each monolayer pattern shown in (A) and (F) respectively; (D) and (I) experimental validation of the predictions in (B) and (G) respectively, using the experimentally constructed patterns, as shown in Fig. 5; (E) and (J) experimental validation of the predictions in (C) and (H) respectively. In the experimental isochronal maps, the selected paths of wavefront propagation along which CV was calculated are shown by black arrows, and their corresponding values are displayed. The color scales indicate time values measured in seconds.

