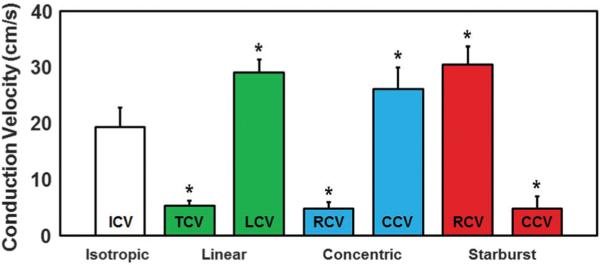
Fig. 9.
Bar-plot of average experimental conduction velocities for each pattern. All values were statistically different from the isotropic ICV. Similarities were noted between linear TCV and LCV and their respective concentric and starburst CVs at regions away from the center of the patterns. These similarities also applied to the anisotropy ratio of CV (AR) for all three anisotropic patterns as discussed in the text.

