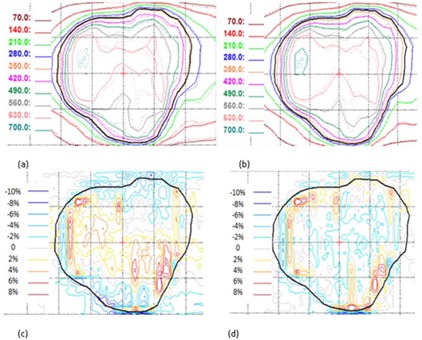
Figure 3.

Dosimetric effects of one vs. three apertures at each beam. Panels (a) and (b) show the planar dose distributions in cGy from single aperture and three apertures overlay with film, respectively. The film measurement is in dotted lines and calculation is represented by solid lines. Panels (c) and (d) show the corresponding dose difference (film ‐ calculation) for (a) and (b), respectively. The dotted display grid size is .
