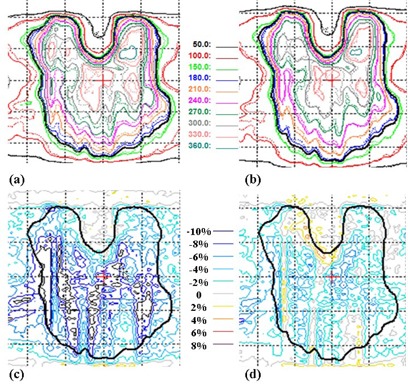
Figure 4.

Comparison of dose calculations with film measurement for paraspinal case 1 with HDMLC. Panels (a) and (b) show the planar dose distribution in cGy calculated without volume‐averaging correction and with volume‐averaging correction, respectively. The film measurement is in dotted lines and calculation is represented by solid lines. Panels (c) and (d) show the corresponding dose difference as a percentage of the average dose (film ‐ calculation) for (a) and (b), respectively. The thick black line defines the ROI for average dose and gamma pass rate. The dotted display grid size is .
