
Fig. 4.
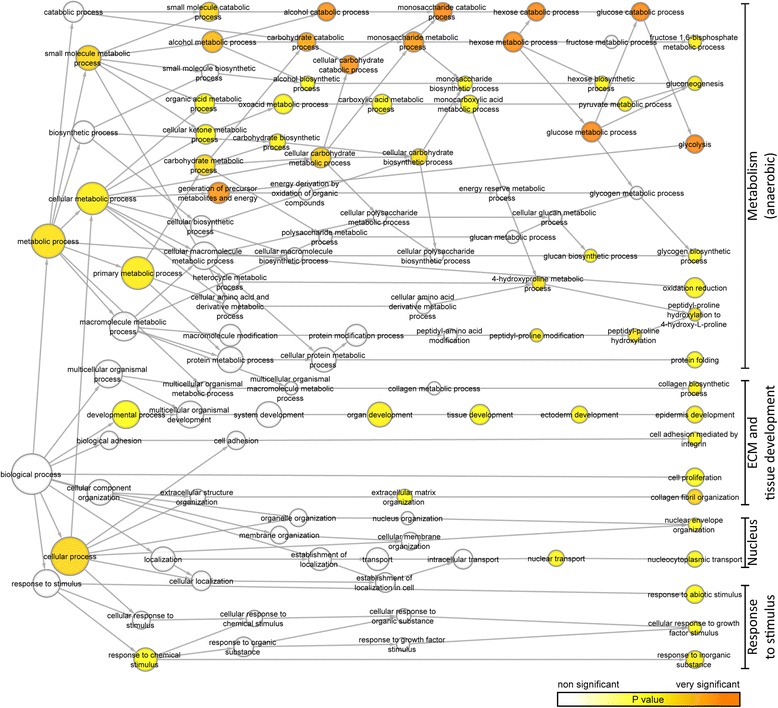
Gene ontology (GO) analysis of genes upregulated by hypoxic preconditioning of ASCs. The analysis was performed in Cytoscape using the BiNGO plug-in version 3.0.3. Presented is a reduced network showing all biological process categories that were significantly over-represented based on the genes corresponding to the upregulated proteins identified from all three donors. The color scale indicates the level of significance of the overrepresented GO category (adjusted p < 0.05). The size of the circles is proportional to the number of genes in each category. ECM extracellular matrix