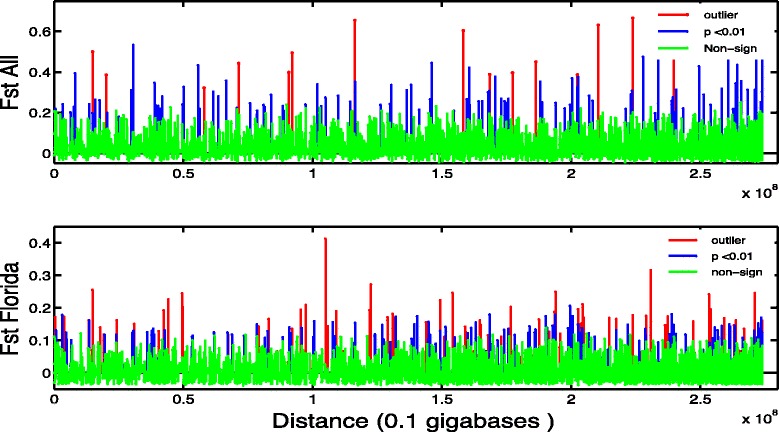
Fig. 3.

Locus specific genetic distance (FST value) by position relative to the A. digitifera genome. Significant FST values that are blue, and the subset that are outliers (potentially adaptive) are in red. SNPs with non-significant FST values are green. Distance along the X-axis is the sum of distances among the 4,765 scaffolds. a FST values for all five populations. b FST values for only the three Florida transects (i.e., Broward, Miami-Dade and Monroe, without Wild)
